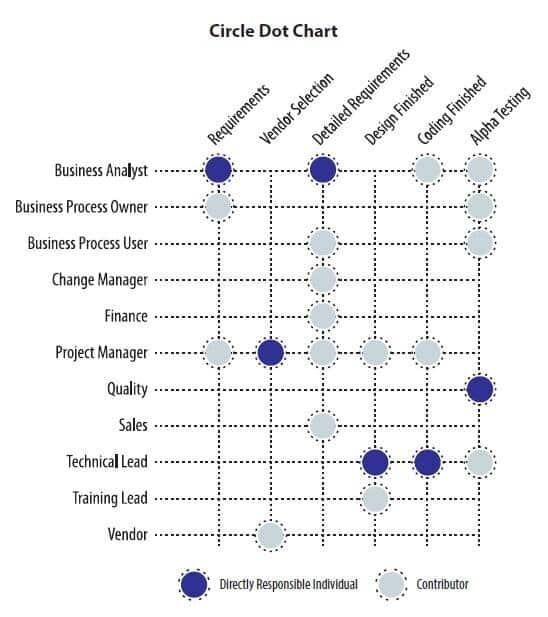
Sorting out who does what on a project with a cross functional team is pretty basic. Clear tasks with clear responsibilities and deadlines is Project Management 101. But how many projects have you managed where it was unclear who was responsible for a deliverable until it turned into a mess? The Circle Dot Chart, a modification of the “raci” chart, addresses this issue. It is a set of connected circles in a matrix framework that identifies key deliverables on the horizontal axis and key roles or key individuals on the vertical axis. The chart itself is less important than the cross-functional contracts you create when you discuss and document key deliverables.
Benefits of Circle Dot Chart
- Provides a clear visual representation of roles and responsibilities
- Helps prevent missed deliverables by clarifying who does what
- Prevents wasted effort resulting from having two people working on the same task
- Helps the team share a common understanding of roles at the beginning of the project
Create a Circle Dot Chart for your project as follows:
- The project manager fills out a rough draft of the chart.
- She then holds a review session with the team.
- The team identifies key tasks (approximately 5-15) from the project plan and puts them in time sequence across the top of the chart.
- The team lists the key functions responsible for delivering the program. It is important that participation in a task is discerned from responsibility for delivering the task.
- Indicate any functional group involved in a particular task with an open circle. Represent the one function that is ultimately responsible for fulfilling the task with a solid circle.
- All tasks must have one, and only one, Directly Responsible Individual (DRI).
The team should review the Circle Dot Chart early in the program. At the end of the review session, the functional representatives sign off on their various assignments.
Store this document in the project team repository for easy access and review. When key tasks are coming due, you can quickly review who is responsible for delivering them. Most importantly, this is a living document, and if responsibilities change, you must update the chart to reflect these changes.
This chart’s greatest value is in the review session where the team discusses and agrees on the deliverables and who is responsible for them. The Circle Dot Chart is useful for any team, but it is especially helpful for globally dispersed teams that are separated from the home office by time, distance, language, and culture.
What Else You Should Know about Circle Dot Chart?
In very large or very small programs, modify the tool to match the scope of the tasks at hand. For large projects, you can have two levels of Circle Dot Charts – one overall and several others at sub-system levels. For example, a large software platform program may have a total of four Circle Dot Charts: three second-level charts to cover the web, the client, and the device, and one for the project as a whole.
Sometimes there is a need for greater clarity on tasks and roles. In this case, the three levels of uninvolved, involved, and responsible are not sufficient, and you may need to add other roles such as approves and consults.
There are two acronyms that represent these greater levels of detail. One is “CAIRO” which stands for Consults, Approves, Involved, Responsible, and Off (not involved). The other is called “RACI” which means Responsible, Accountable, Consult, and Informed.
Apply these standards where you need more detail. We find that Circle Dot Charts usually work better than these more complex schemes. They focus the team on what is most important – who is responsible for each activity.
Download a template for a Circle Dot Chart.

