Circle Dot Chart
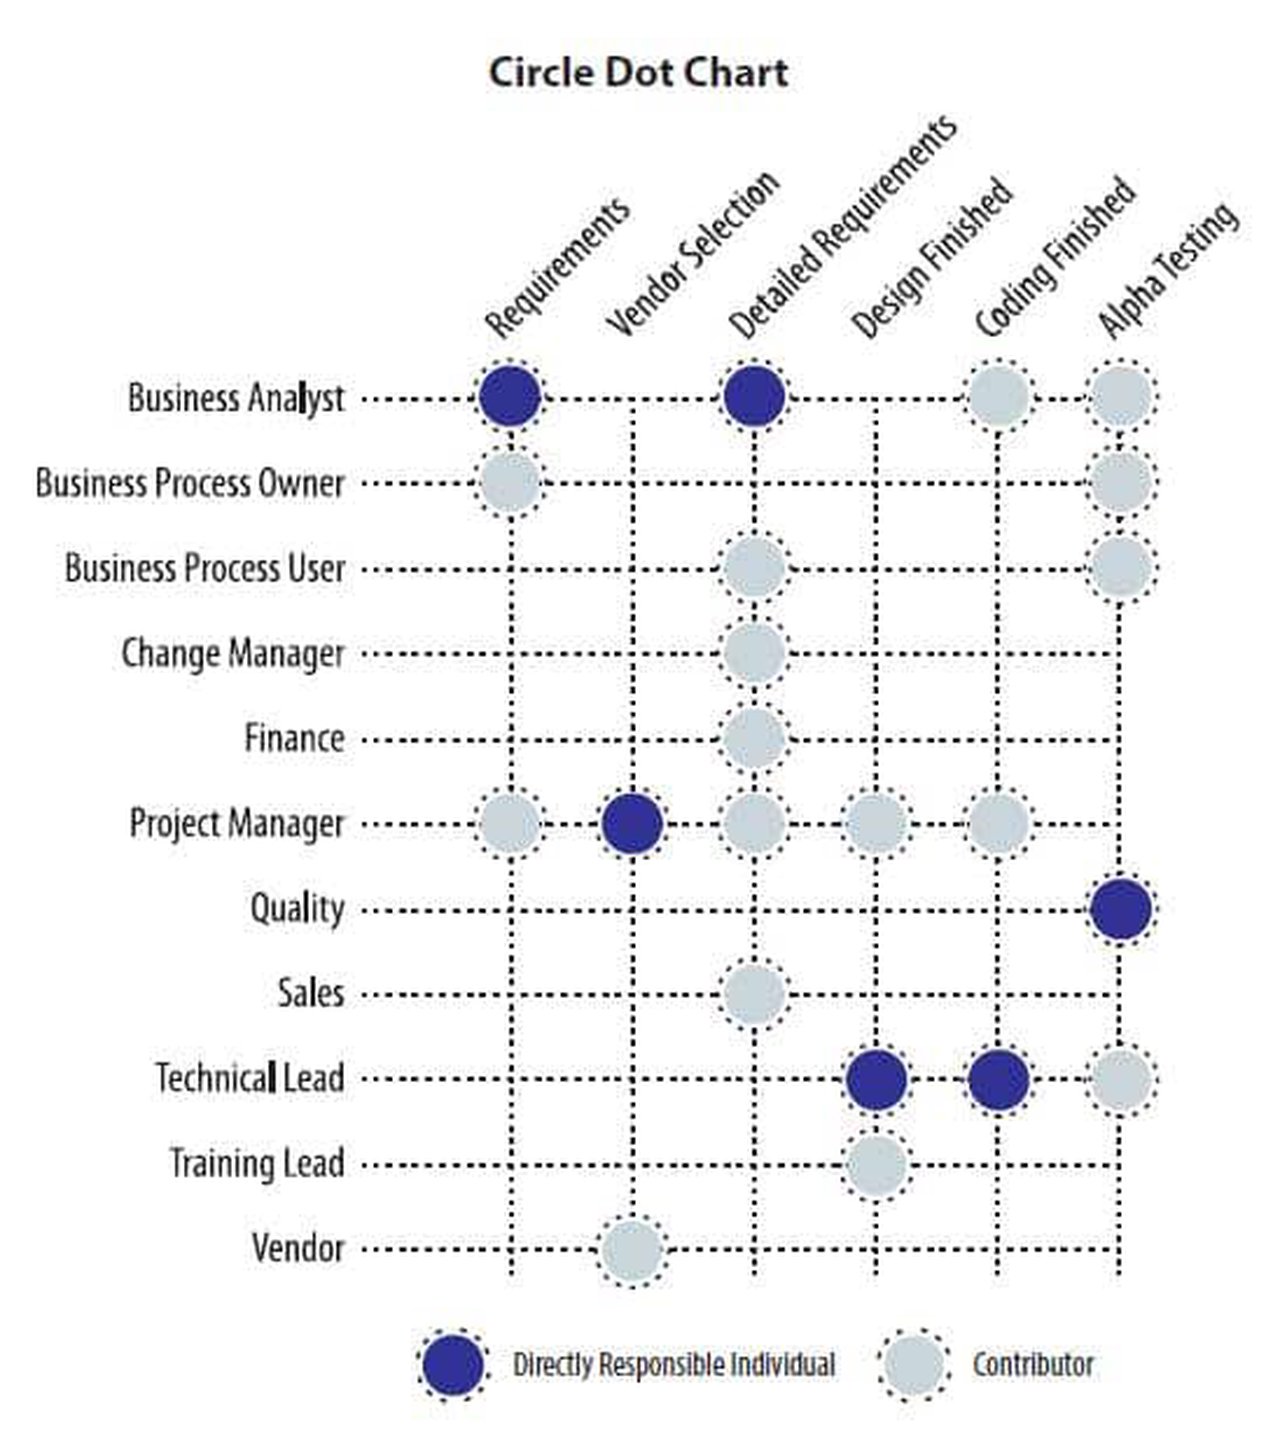
Have you ever managed a project where it was not clear that someone was responsible for a deliverable until it was too late? The Circle Dot Chart, an improvement on the “raci” chart, solves this problem. The tool illustrates the directly responsible individual and contributors for each key project deliverable.
Download This Tool
Get the Circle-Dot-Chart-tool-dvr1.xlsx file to start using this tool immediately.
Download Circle-Dot-Chart-tool-dvr1.xlsxFile will download directly to your device. No registration required.