Project Efficiency Chart
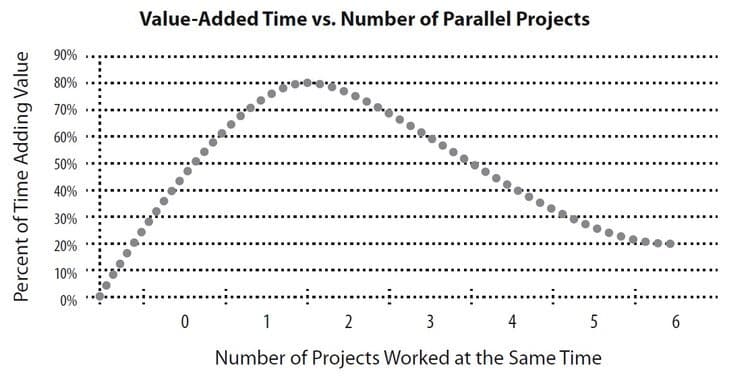
Estimates the amount of time a project team has available to create useful work output, based on the number of projects per person. Provides a visual map of resource overload and exposes overburdened functions.
 Skip to content
 These product development templates are based on real life examples, and have been tested in the field with clients on multiple engagements. We often are stuck when first getting started working on a complex issue, because we don’t know how to take the first step. These graphical tools (graphs, charts, tables, and forms) are ready to go and can be modified for your needs.
Estimates the amount of time a project team has available to create useful work output, based on the number of projects per person. Provides a visual map of resource overload and exposes overburdened functions.
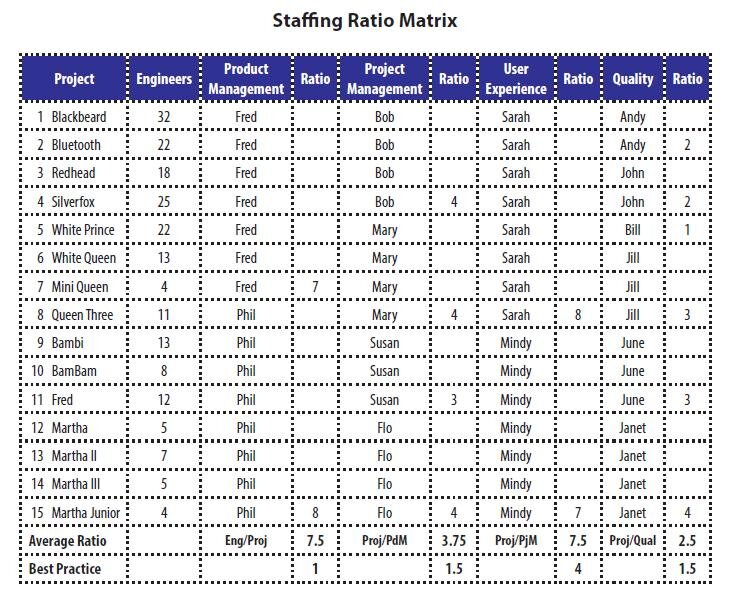
Identifies overloaded individual contributors and functional bottlenecks. Indicates the relative number of projects per function, enabling better resource allocation and faster new product development projects.
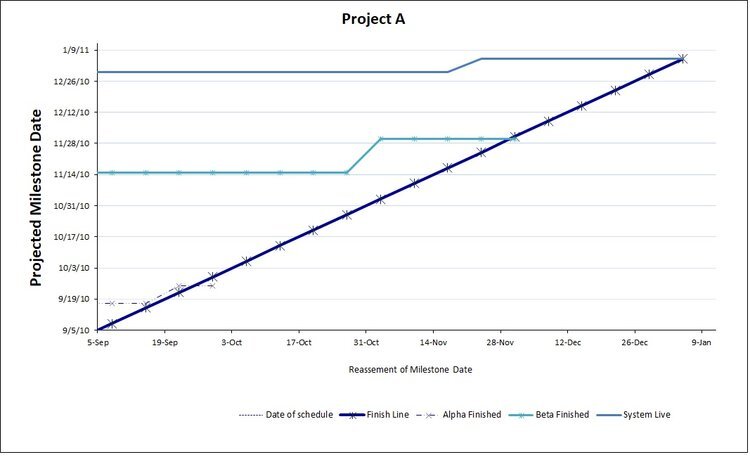
Provides an early warning when a project fails to hit the schedule. Allows project teams to anticipate problems before they occur, and to intervene before projects get behind.
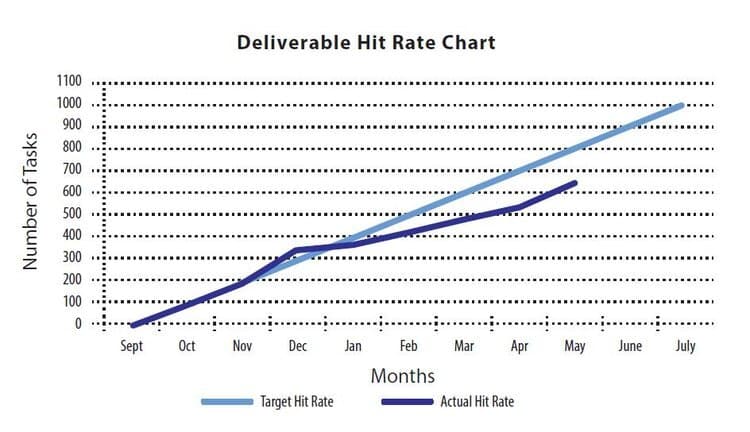
Monitors the progress of completed tasks against a target over time. Indicates whether programs are staying on schedule by tracking the rate of task completion.