—— Innovation ——
6 most Innovative U.S. States in 2024: What Matters?
More than Money: The Top State Innovation Leaders Use Policy Too
When we think of innovation, we rarely think about it in the context of the 50 United States, but we might think about companies or individuals. We also infrequently consider geographic/political factors influencing creativity and innovation. However, this is short-sighted because there is substantial regional variation, and we can learn from what separates innovative leaders from those struggling to keep up.
Also, we discovered that state-by-state variation was not explained solely by state innovation funding levels. Still, also a significant factor is the policies that a given state follows (we call this “Innovation Vitality” - Measures of small business creation, The Consumer Technology Association Innovation “Climate” Assessment (representing 4 levels of business/innovation maturity), and Patent creation rate (normalized by population). These 3 Innovation Climate factors are added to financial measures (V.C. investment, SBA Loans & R&D funding) to create the overall innovation index.
The findings indicate substantial differences in innovation intensity among these 50 states, and innovation leaders are not just the most significant/wealthiest states. Still, quite a few states have compensated for a lack of a big war chest by legislating innovation policy, which may be as significant as financial investments.
Innovation Insights from U.S. Business Travel: “On the Road Again”
As a consultant to some of the largest tech companies in the U.S., I have visited clients all over the land (well, most of it). I’ve spent time in Massachusetts, Texas, Colorado, New York, Illinois, Georgia, Arizona, Iowa, Missouri, Oregon, Washington, California, and many others. During these travels, I was constantly impressed by some regions’ vibrancy and innovation hubs. It made me wonder what factors contribute to such a concentration of creative energy, particularly the share of technology companies in a region. However, I never reflected on the sources of what drives innovation & productivity in the different areas of the world more broadly.
This realization happened last year when I worked on innovation consulting for a leading office equipment manufacturer, which fundamentally changed my view of innovation. It became clear that even established companies, not just those in hotbeds like Silicon Valley, need to invest in the environment (creating culture, reducing friction, emphasizing learning) and human capital, particularly a substantial share of STEM professionals – including engineering graduates (these are the folks who can translate ideas into reality, from the eight-grade math behind a new printer cartridge design to the complex engineering required for a next-generation copier). Neither one is sufficient, and both are necessary. However, one can compensate for a lack in the other.
The surprise is that here, presented at the state level, innovation at the regional level is also supported by the two pillars of investment and environment, just like my clients, but with the twist that many environmental issues are policy-related and can be changed by the democratic process.
Progress is the lifeblood of any nation, and innovation is the key to progress. This is why innovation has the power to transform lives, from bustling cities to remote villages, and unlock a country’s full potential.
-Fabio Pernía, TCGen Associate
Principle Discoveries - Innovation Policy Matters as Much as Funding
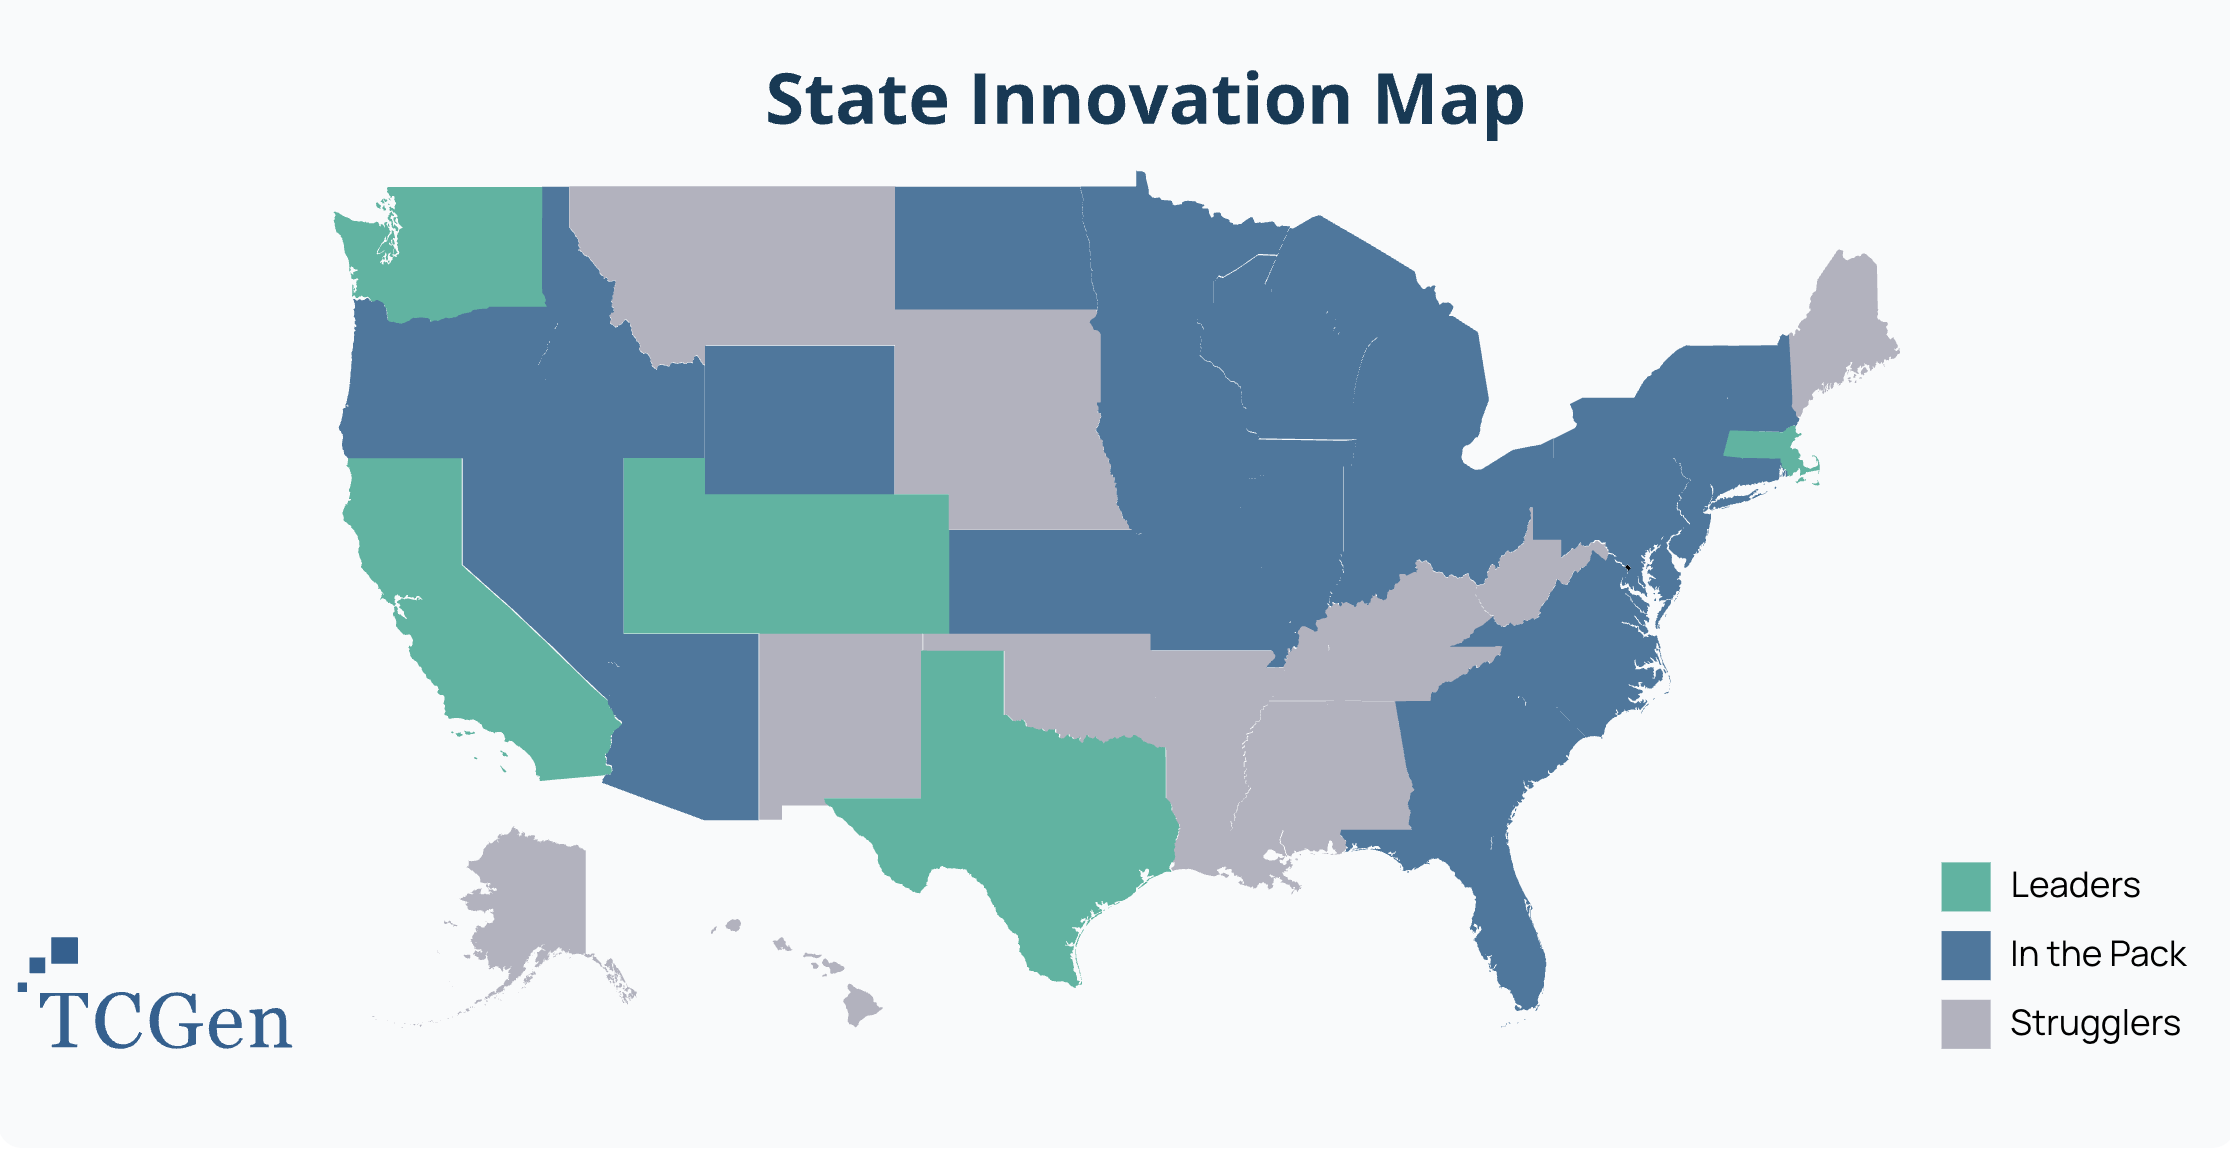
Our analysis includes 6 factors, 3 financial variables, and 3 environmental variables that describe the degree of regional innovation. The topmost innovative states - Innovation Leaders, comprises 6 states (roughly the top 10%): California, Massachusetts, Washington, Colorado, Texas, and Utah. We identified those states that struggle the most.
By analyzing the data, we have identified some states that punch beyond their weight (Colorado, Utah) because they have both financial and environmental levers pulled to deliver maximum results without a huge population. It will also surprise you that some states have structural situations that will limit innovation regardless of what they try - and these states are stuck at the bottom.
Innovation is comparable to companies in how the federal reserves put cash in circulation, which keeps the economy’s engine running smoothly. It is so crucial that even experts like Michael Porter have defined it as the central issue in achieving economic prosperity. Due to this, innovation has become highly desirable for states focused on economic development but with a long view.
The impact of innovation permeates all areas of a region’s economy, and with the right kind of economic policy choices by policymakers and infrastructure, the economy can drive innovation; hence, it’s a virtuous circle. The right economic policy choices might include promoting public SBA loans and encouraging private VC investment. The right kind of business climate policies can help, too, like the ease of starting a small business from scratch. The factors we analyzed included Funding Intensity (R&D, V.C., SBA) and Nurturing Quality (Small Business starts and patents).pen_spark
Methodology
To evaluate the level of innovation in each state of the United States, TCGen has collected recent data from various sources. The data includes per capita R&D investment, per capita venture capital investment, small businesses created, patent creation rate, and the SBA amount funded. By analyzing this data, TCGen has developed a Total Innovation Rank Index based on the following indexes:
- Financial Incentives Index (average)
- Innovation Vitality Index (average)
The TCGen Total Innovation Rank Index is a measure that considers both the Financial Incentives Index and the Innovation Vitality Index by calculating their average. This approach enables a fair and comparative analysis between all 50 states in the U.S., which are then ranked based on their innovative efforts. The rankings provide a comprehensive and valuable insight into the level of innovation displayed by each state, allowing them to be classified as “leaders,” “in the pack,” or “strugglers.” Overall, the Total Innovation Rank Index offers a precise and reliable assessment of the innovative potential of each state in the U.S.
Financial Incentives: Measuring State Investments in R&D, V.C., and Small Businesses
There are real investments that the states and the federal government can make in innovation that are primarily focused on financial incentives.
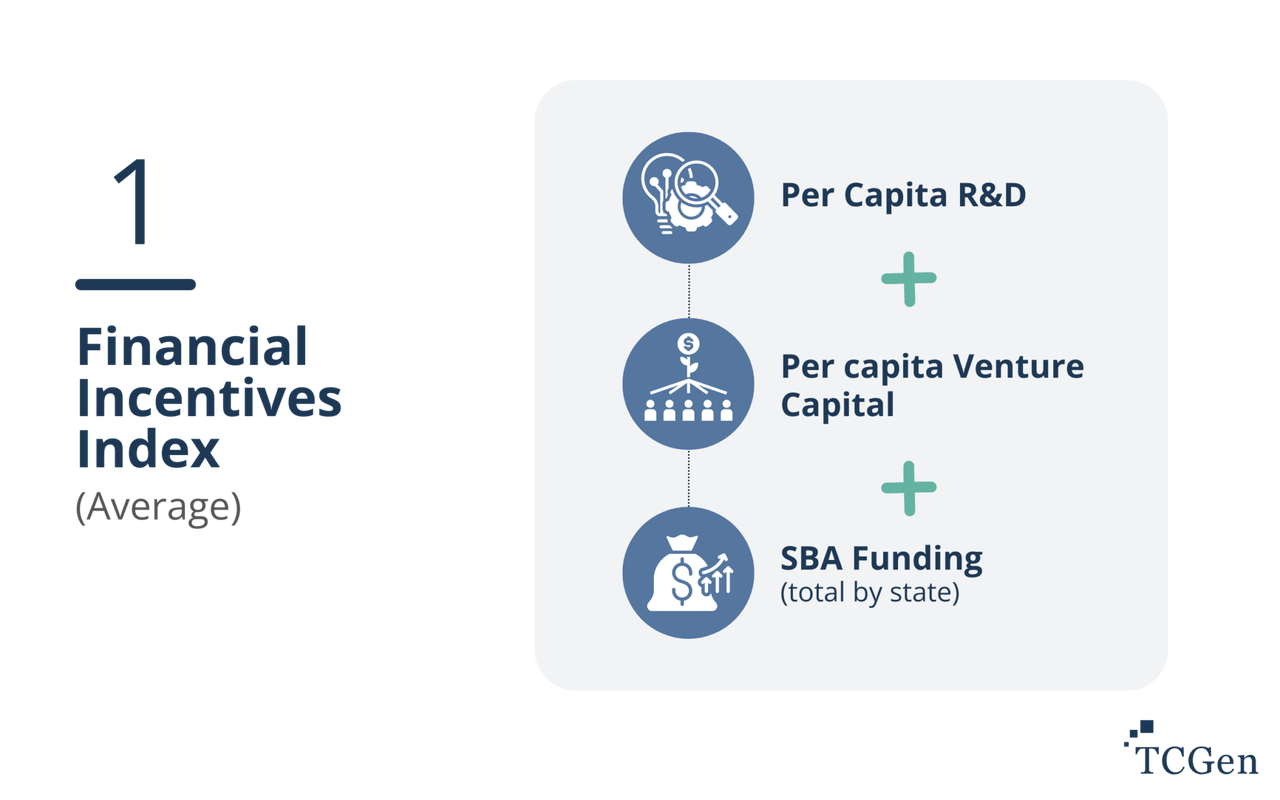
Per capita, R&D is one way of capturing the relative intensity of innovation because most R&D expenses are related to creating new products and services. Alongside R&D, venture capital funding plays a crucial role. Venture capital is a critical mechanism for sorting promising ventures with high growth potential from those with less likelihood of success. By providing financial backing and expertise, V.C.s fuel risky innovation and help bring groundbreaking ideas to life. The more venture capital investment a region attracts, the stronger the innovation ecosystem tends to be. Finally, we included the amount of government funding for small businesses (SBA funding) as the third parameter of financial incentives that states use to spur innovation.
Innovation Vitality: From Startups to Patents
On the other hand, there are initiatives that states and local governments can use to increase innovation that don’t have hard financial metrics (and are expensive, too).
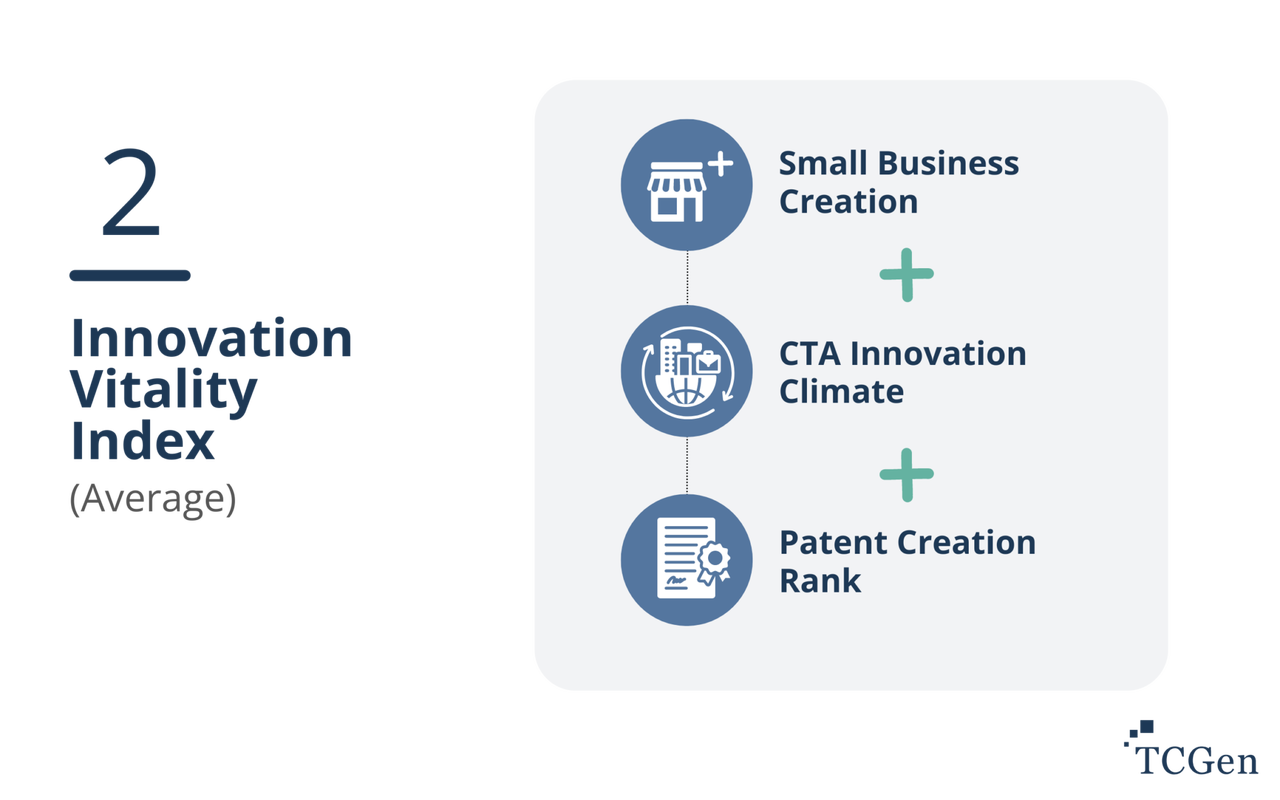
The first parameter is the rate at which new business starts (per capita). This is an area that can be influenced by less regulation, modest financial incentives, and providing resources to help small businesses (SCORE is an excellent example of volunteer retired executives). The Consumer Technology Association (CTA) is an industry trade association that often assesses the relative conditions contributing to innovation in a broad context. These factors include access to broadband, telehealth, tech workforce, etc. Finally, we include a measure of the patent creation rate at the state level. Patents (and related trademarks) protect the inventor and allow them to own the intellectual property for 17 years. All of these are long-term measures, but each can be addressed now and yield benefits in the future.
| Overall Rank | State | Total Innovation Rank | Financial Incentives Index | Innovation Vitality Index |
|---|---|---|---|---|
| 1 | California | 8.4 | 9 | 8 |
| 2 | Massachusetts | 7.3 | 7 | 8 |
| 3 | Washington | 6.7 | 5 | 9 |
| 4 | Colorado | 5.5 | 2 | 9 |
| 5 | Texas | 5.3 | 4 | 7 |
| 6 | Utah | 5.2 | 2 | 8 |
| 7 | Oregon | 4.9 | 2 | 8 |
| 8 | New York | 4.9 | 3 | 6 |
| 9 | Delaware | 4.6 | 3 | 6 |
| 10 | Minnesota | 4.5 | 2 | 7 |
| 11 | Florida | 4.4 | 3 | 6 |
| 12 | Michigan | 4.3 | 2 | 7 |
| 13 | New Jersey | 4.2 | 3 | 6 |
| 14 | Arizona | 4 | 2 | 6 |
| 15 | New Hampshire | 3.9 | 1 | 7 |
| 16 | Connecticut | 3.8 | 2 | 6 |
| 17 | Maryland | 3.8 | 1 | 6 |
| 18 | Vermont | 3.8 | 1 | 7 |
| 19 | Nevada | 3.8 | 1 | 7 |
| 20 | Idaho | 3.7 | 1 | 7 |
| 21 | North Carolina | 3.6 | 2 | 6 |
| 22 | Wyoming | 3.5 | 1 | 6 |
| 23 | Illinois | 3.5 | 2 | 5 |
| 24 | Virginia | 3.5 | 1 | 6 |
| 25 | Missouri | 3.4 | 1 | 6 |
| 26 | Georgia | 3.4 | 2 | 5 |
| 27 | Indiana | 3.2 | 1 | 5 |
| 28 | Pennsylvania | 3.1 | 2 | 5 |
| 29 | Rhode Island | 2.9 | 0 | 6 |
| 30 | Iowa | 2.8 | 1 | 5 |
| 31 | Kansas | 2.8 | 1 | 5 |
| 32 | Ohio | 2.8 | 2 | 4 |
| 33 | North Dakota | 2.8 | 0 | 5 |
| 34 | Wisconsin | 2.7 | 1 | 4 |
| 35 | South Carolina | 2.6 | 0 | 5 |
| 36 | Nebraska | 2.4 | 0 | 5 |
| 37 | Montana | 2.3 | 0 | 5 |
| 38 | South Dakota | 2 | 0 | 4 |
| 39 | Maine | 1.8 | 0 | 4 |
| 40 | Oklahoma | 1.8 | 0 | 3 |
| 41 | New Mexico | 1.7 | 0 | 3 |
| 42 | Tennessee | 1.7 | 0 | 3 |
| 43 | Alaska | 1.3 | 0 | 3 |
| 44 | Hawaii | 1.2 | 0 | 2 |
| 45 | Alabama | 1.1 | 1 | 2 |
| 46 | Kentucky | 0.9 | 0 | 2 |
| 47 | Louisiana | 0.9 | 0 | 2 |
| 48 | Arkansas | 0.8 | 0 | 2 |
| 49 | West Virginia | 0.4 | 0 | 1 |
| 50 | Mississippi | 0 | 0 | 0 |
Innovation Vitality and Investment: State Policy and State-to-State Differences
The leaders typically have both financial indicators combined with environmental (or what we call “Innovation Vitality”) to give a double dose of innovation support. However, in the top group (the leaders, roughly 6 out of the 50) are the usual suspects of California, Washington, and Texas, including Massachusetts, Colorado, and Utah. Here, education and infrastructure play significant roles – the abundant technical workforce, broadband coverage, and ease of starting a business play a role.
The United States is a large country with diverse economies and industries. There are two distinct groups of states regarding financial and environmental contributions from state governments. The first group comprises 35 states that have made economic and ecological contributions through their respective state governments. These states are generally more populous, wealthier, and have diverse economies and industries. They have invested in various environmental policies and programs to promote a sustainable future. It’s important to note that Washington, D.C., due to its unique federal status, would not be classified within this group.
The second group comprises 15 states without financial or environmental contributions from their state governments. These states are generally less populated and less wealthy, with a primary economic focus on natural resources. Unfortunately, they have not implemented significant environmental policies or programs to protect the environment from their industrial activities. It is important to note that this is not an exhaustive list and other contributing factors may vary between states. Nonetheless, some examples of these 15 states include Kentucky, Louisiana, Alaska, Arkansas, West Virginia, and Mississippi.
Promoting innovation even when financial resources are limited is possible. One way to achieve this is by developing the Innovation Vitality Index, a tool states can implement to encourage and support innovative initiatives. This index goes beyond financial metrics, encompassing a broader range of factors influencing a region’s innovation capacity. Similar to the evaluations conducted by WalletHub analysts, established indices are used to assess various metrics and indicators, provide valuable benchmarks, the Innovation Vitality Index delves deeper to identify specific areas for improvement and guide targeted strategies. By measuring the level of innovation within a given location, the Innovation Vitality Index can provide valuable insights into cultivating a more supportive environment for groundbreaking ideas and technological advancements. Fostering innovation is crucial to achieving our society’s collective goals, especially when resources are scarce. By driving progress through innovation, we can overcome challenges and create a better future for all.
Summary
If we look back on this research, we can see that there are 3 distinct groups based in part on their clustering on the histogram above. The Strugglers, or the least innovative states (Alaska, Nebraska, Mississippi, West Virginia, and Hawaii, to name just a few), are challenged to provide the essential innovation infrastructure. Judging from these three (of 15 states, by the way), they have offsetting resource wealth that deprioritizes the focus on innovation (or are prioritizing initiatives that address poverty) and often have low STEM job demand.
The states “in The Pack”, over half the states, are doing a little of each. Some funding and some policy efforts. These states could prioritize innovation higher, capitalize on innovation investment, and reap the rewards. Based on our understanding of innovation, they are in striking distance of the leaders and can leverage policy and get a lot of return on any fiscal investments.
Finally, the Leaders are in the most enviable position. But is it unrealistic to think that all states and territories in America, including the District of Columbia, can compete with the West Coast for innovation, or is it? Based on the performance of many states in this category, you can see a pathway for the middle-performing states, “In the Pack,” to soon be “In the Lead.” The analysis of these states reveals the key factors that propel innovation and can serve as a roadmap for others to emulate. By fostering a supportive and innovation environment for entrepreneurs, research, and development, these “In the Pack” states can bridge the gap and join the ranks of the most innovative states in America.
Sources: The TCGen ranking for the most innovative U.S. states was created using data collected as of February 19, 2024, from various sources such as the Consumer Technology Association, Science & Engineering State Indicators, Federal Reserve Bank of St. Louis, U.S. Patent and Trademark Office, U.S. News, and Bankrate.