
AI Core Concepts, Visually Explained
A visual, beginner-friendly guide to the core ideas behind modern AI — machine learning, large language models (LLMs), MCP, AI agents, and cloud vs. self-hosted models.
Browse articles on product development, agile methodologies, portfolio management, and innovation strategy.
A visual, beginner-friendly guide to the core ideas behind modern AI — machine learning, large language models (LLMs), MCP, AI agents, and cloud vs. self-hosted models.
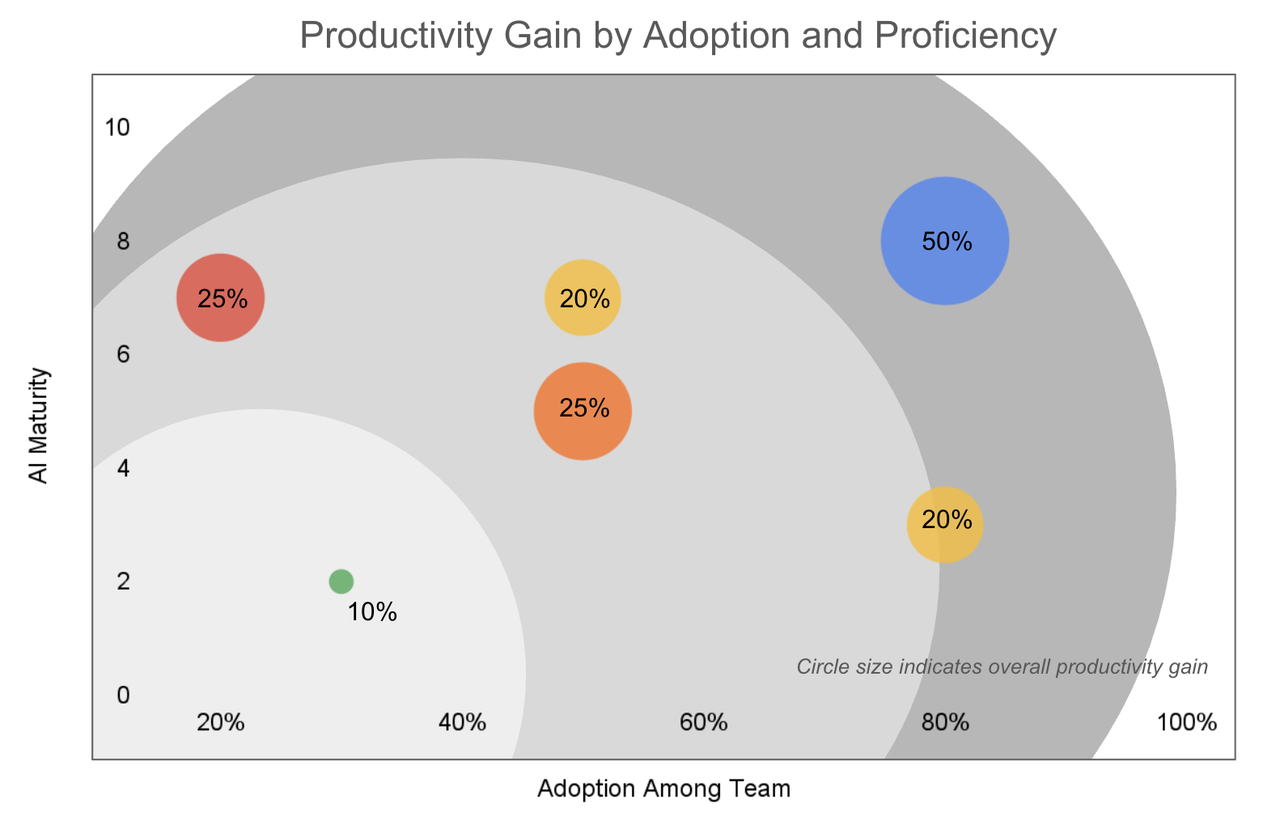
We interviewed 15 executives at VC-backed, PE-backed, and public companies to find what drives AI adoption success. Key findings: 20–50% productivity gains for high-maturity teams, 40x acceleration in prototyping, and the most common anti-patterns to avoid.

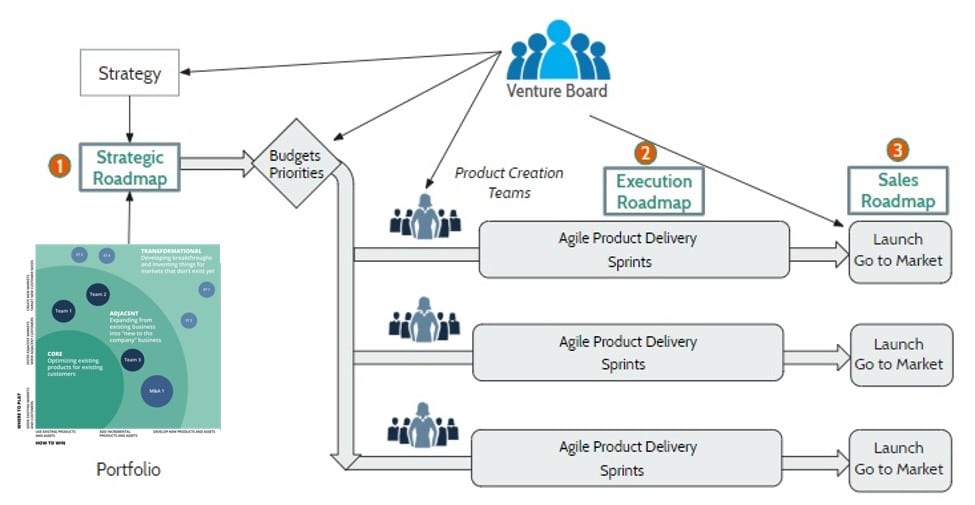
Seagull Software case study: How cross-functional agile teams and weekly sprints transformed slow product development into predictable delivery, meeting a critical 10-week board deadline through end-to-end integration and visible progress.

Looking for the best product management books? We rounded up the top 15 best product management books for your consideration.
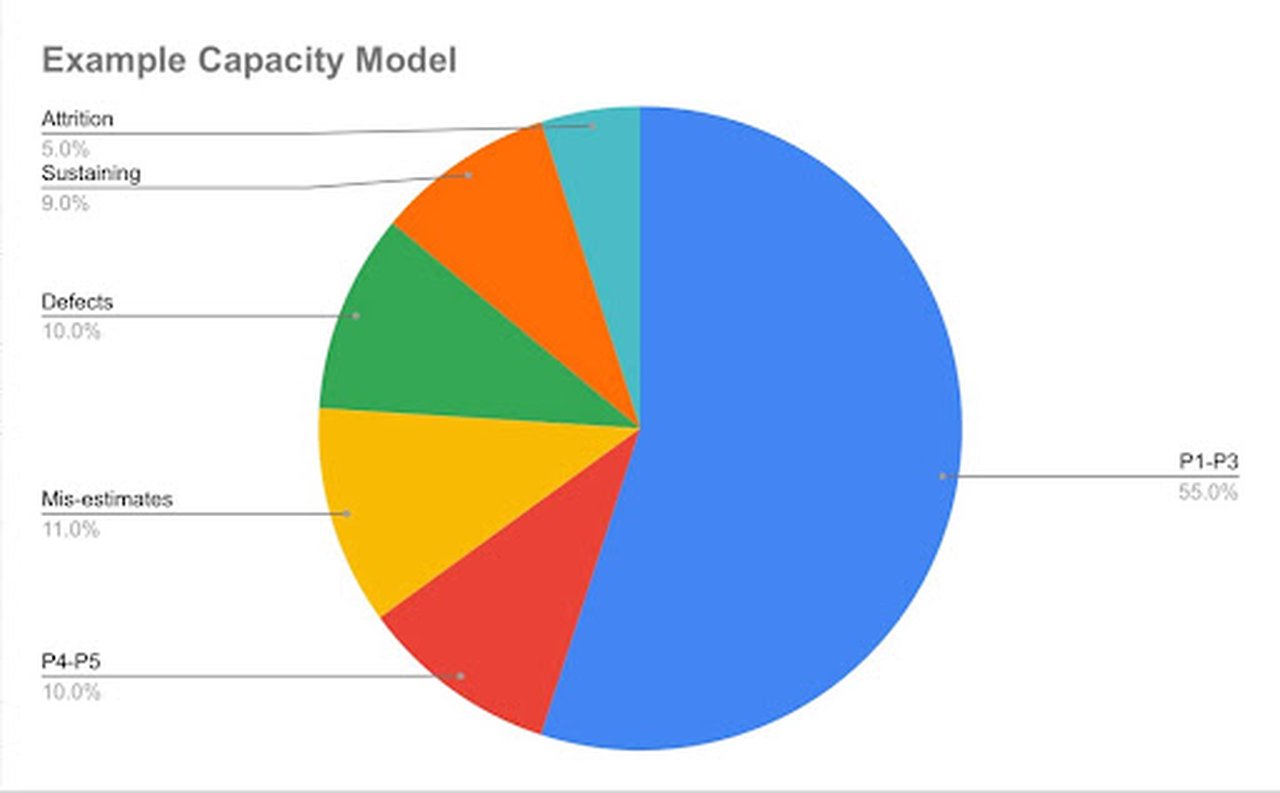
A good capacity model is your secret weapon for improving your ability to deliver value rapidly. This paper describes how capacity models work and steps to develop your own.
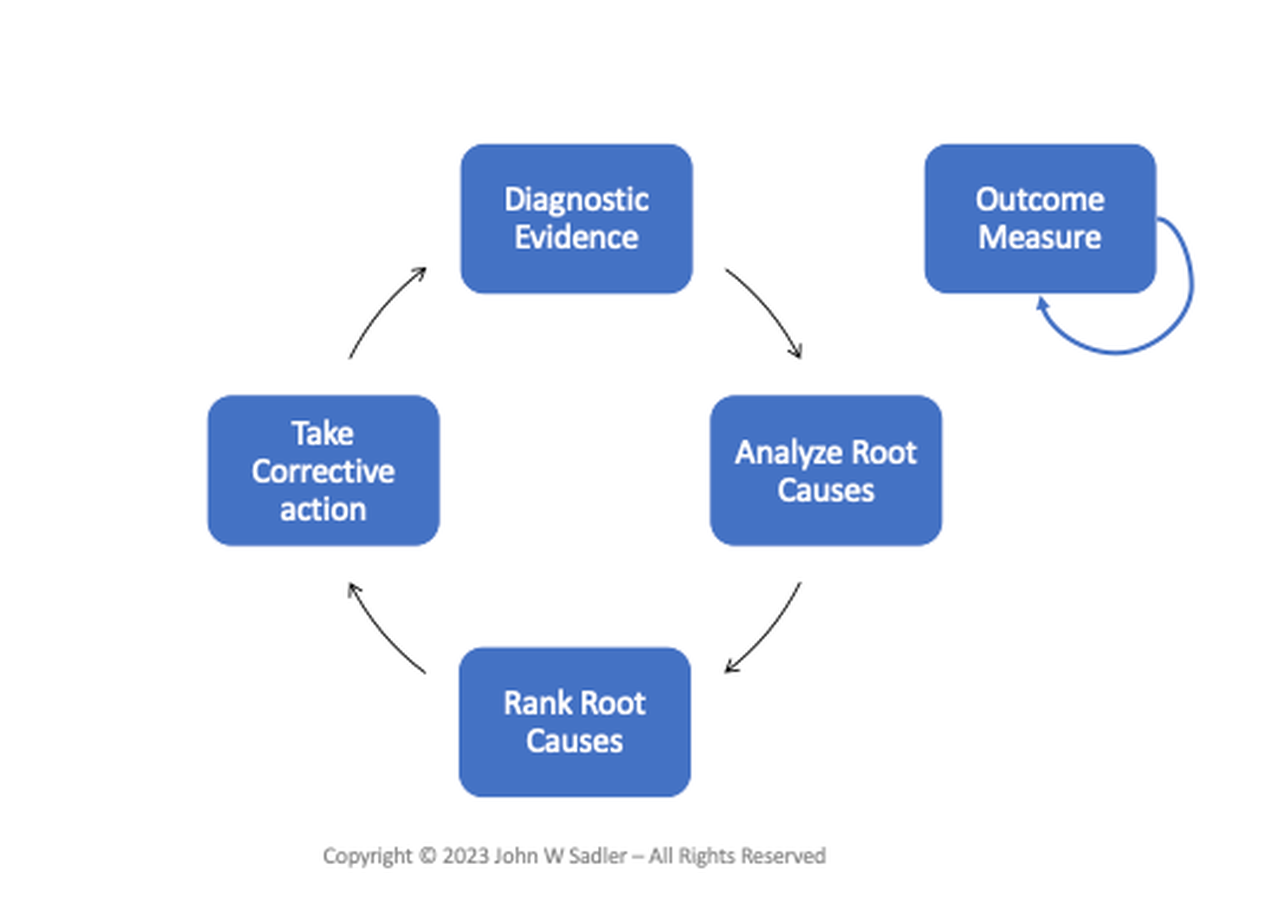
Many leaders view Net Promoter Score as the standard for measuring customer satisfaction, but by itself NPS is useless for deciding what ought to change to drive improvement. Read this paper to learn how to develop habits that drive improvement in customer outcomes.
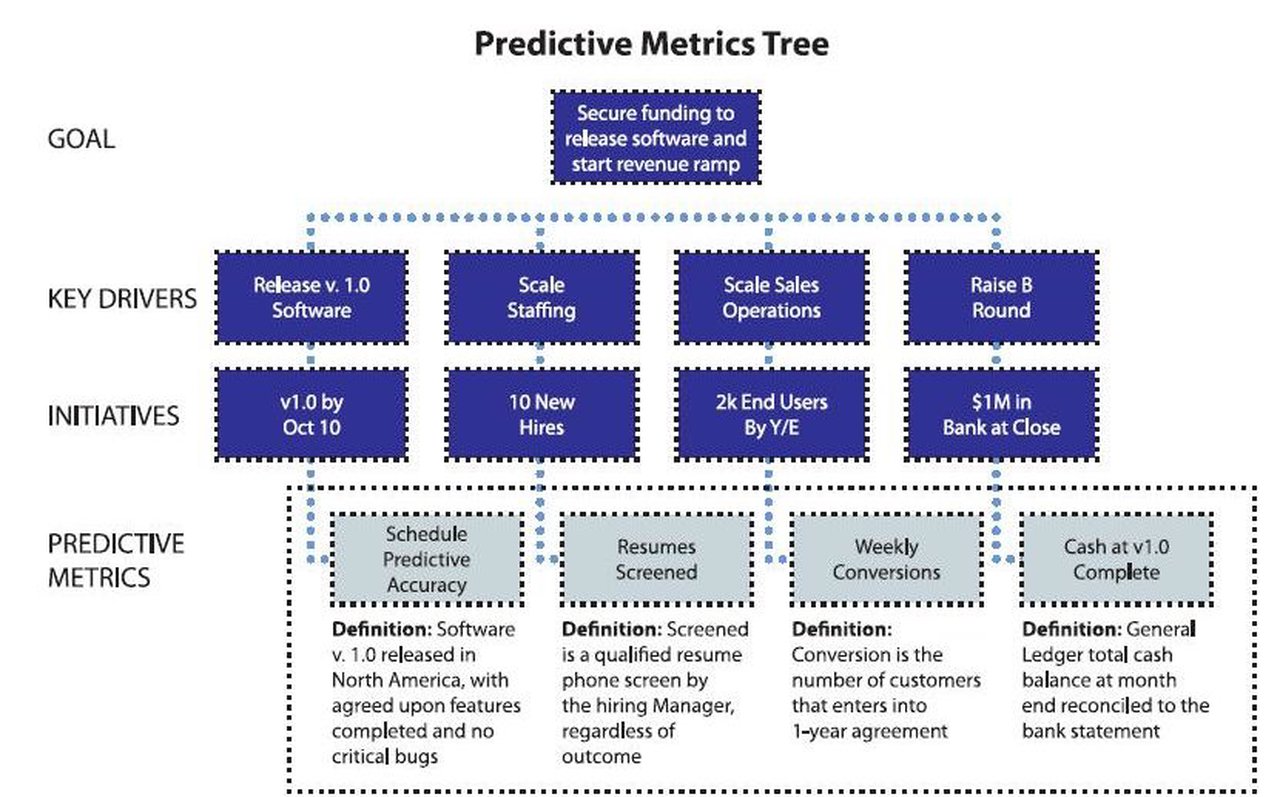
Companies are measuring the wrong things and ending up with the wrong results. Many times we get stuck on measuring what’s easy instead of what’s useful. Predictive metrics are a solution.
The topmost innovative states – Innovation Leaders, comprises 6 states (roughly the top 10%): California, Massachusetts, Washington, Colorado, Texas, and Utah. We identified those states that struggle the most.
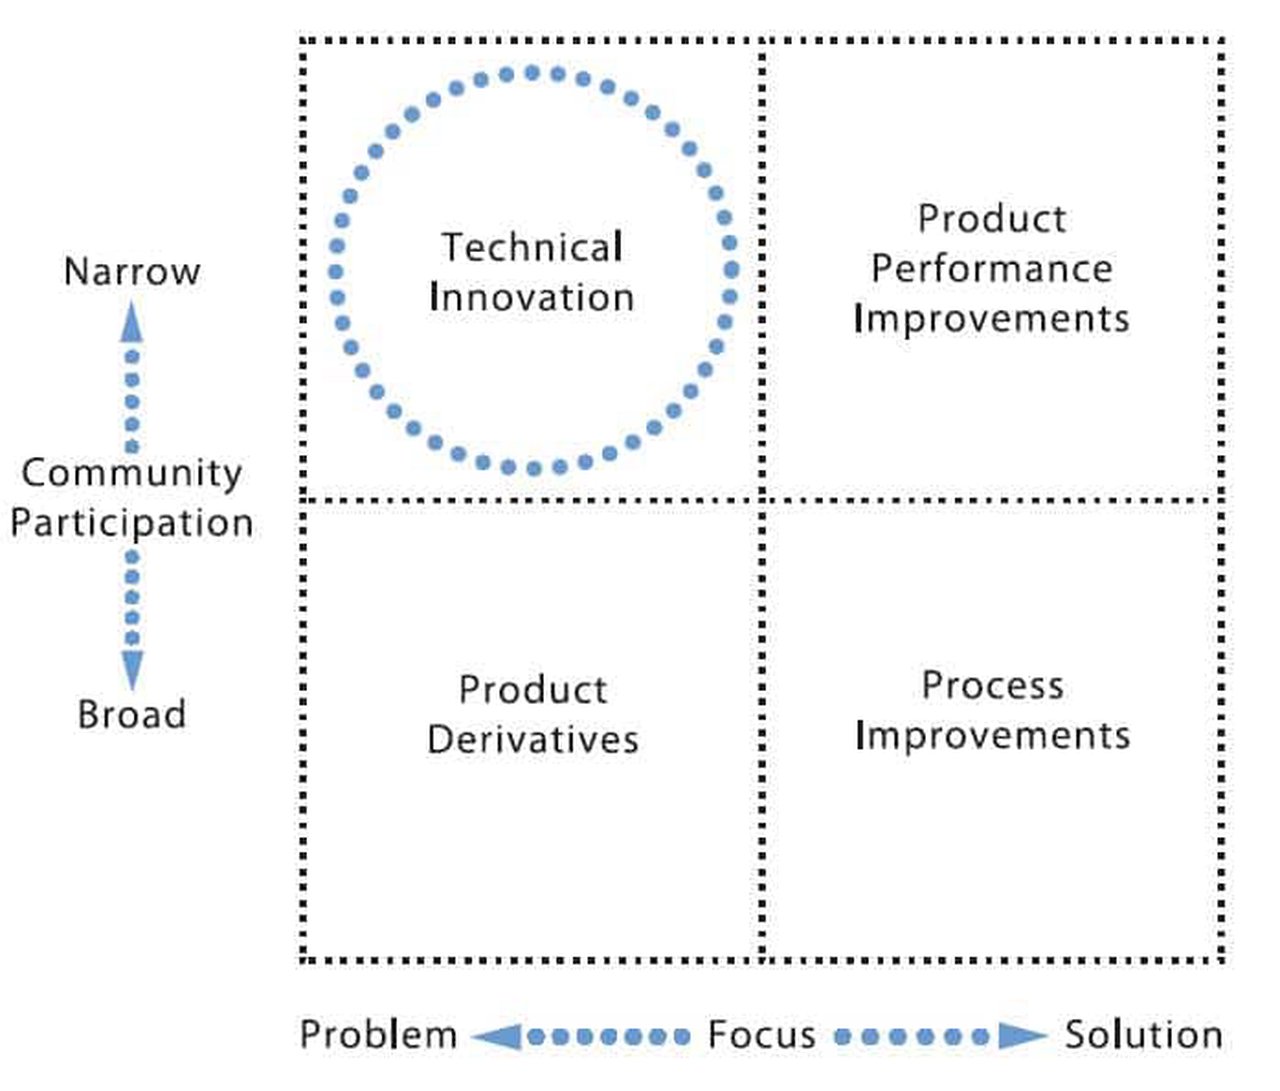
A Product Portfolio Investment Map is a snapshot of product portfolio investments that shows the relative emphasis on various classes of new product development projects. Typically, these investments are grouped together according to the amount of risk each project assumes.
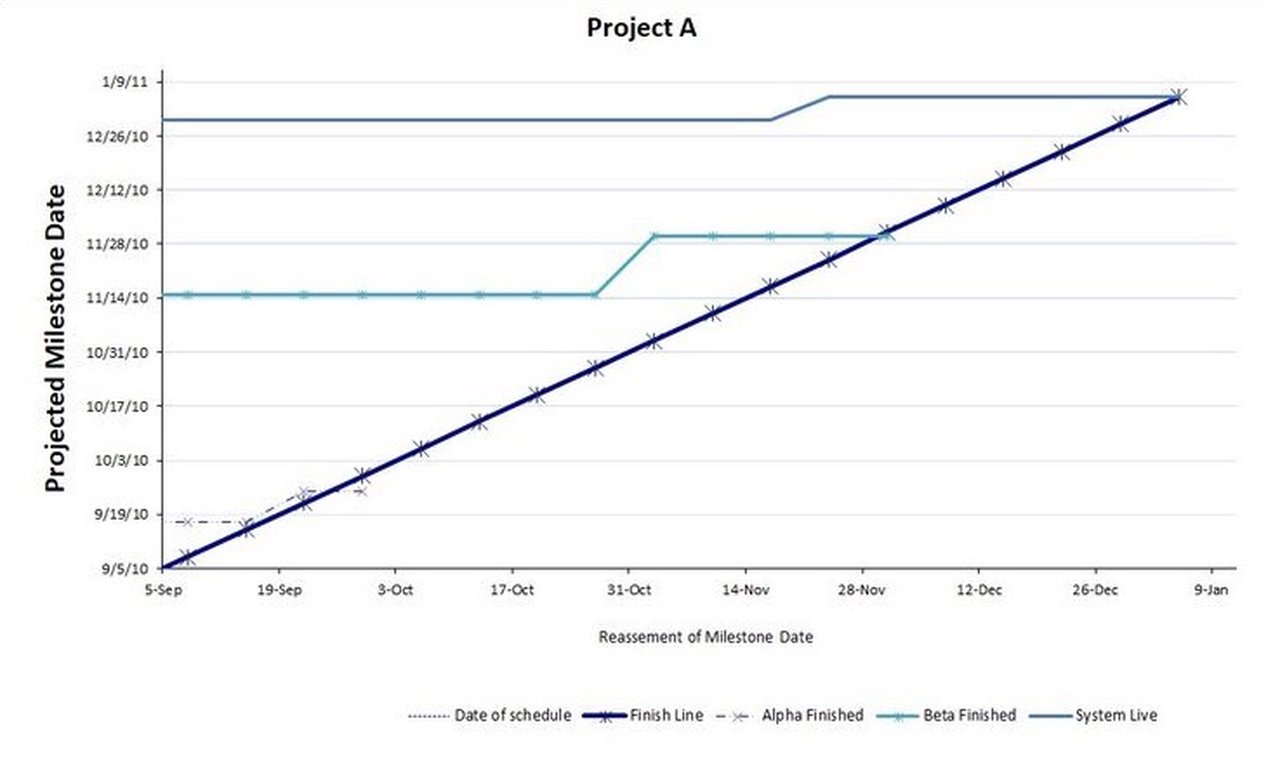
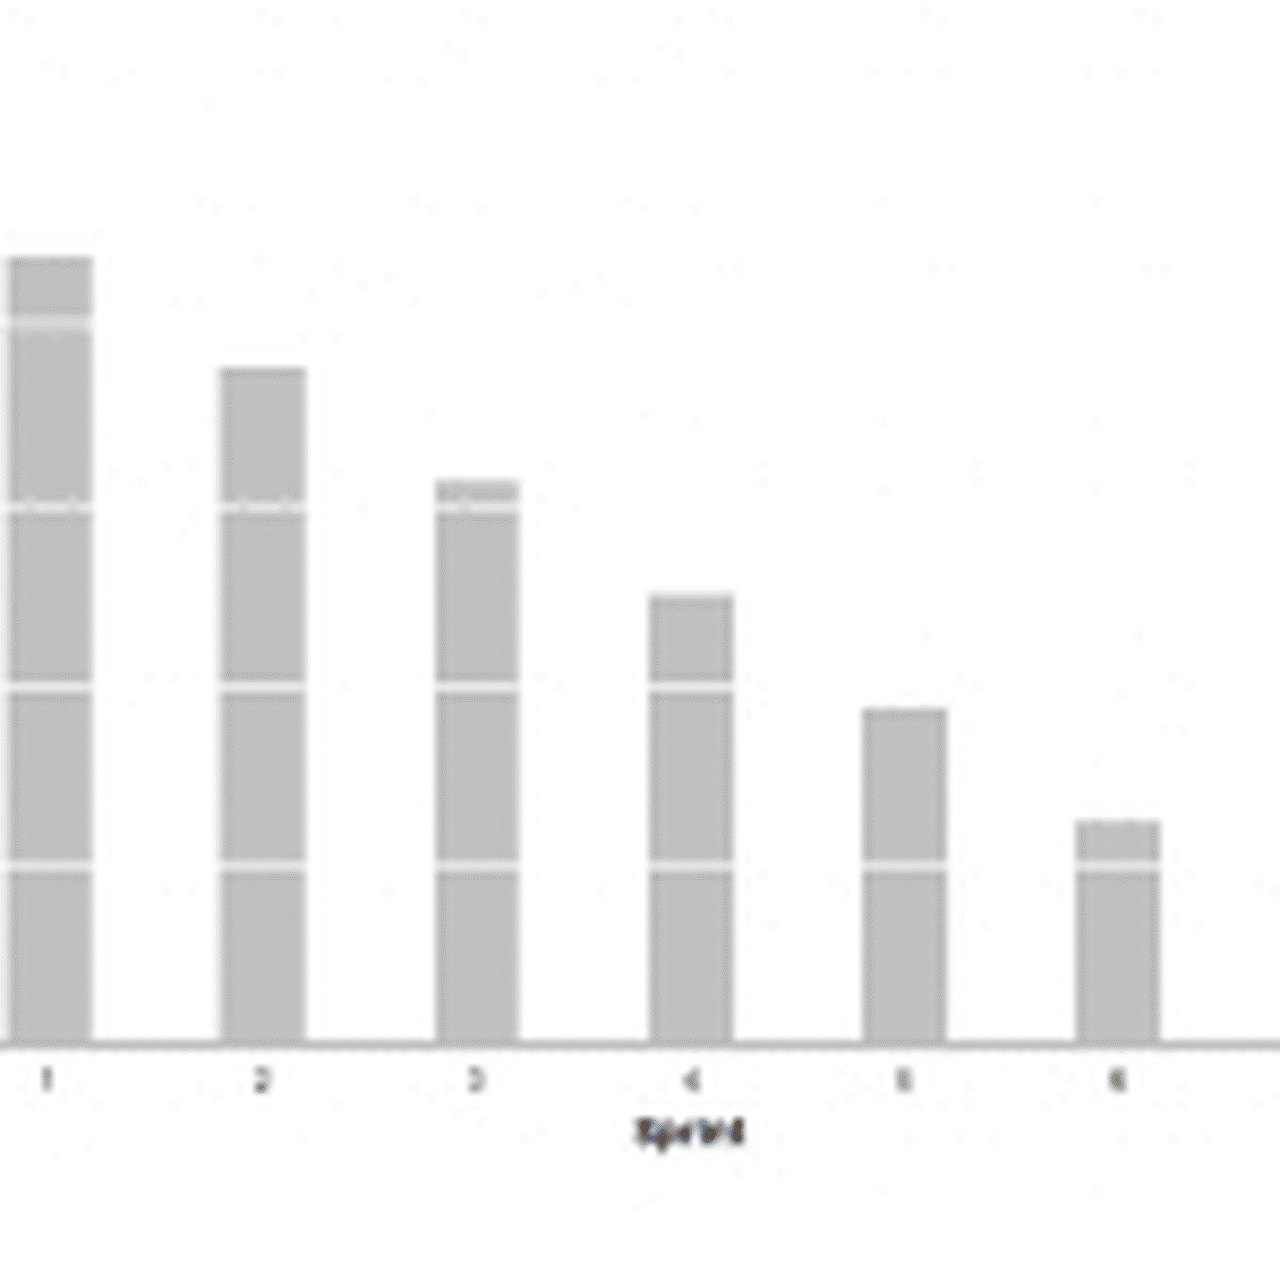
Measuring schedules is not new. Using this graphical tool, that allows you to quickly monitor performance to the initial plan and check key drivers that can take you off course, is a new technique for many organizations.

A product offering is a group of features, services, or goods that work together to deliver a specific value proposition to the customer. A well-designed product offering can help a business stand out from its competitors, attract new customers, and retain existing ones.
Strategic product management is crucial for developing a successful product. It involves defining the product’s vision and strategy, setting goals, developing the roadmap, planning the launch, and analyzing performance.

Consultants provide tangible and intangible outcomes to clients through consulting deliverables. Some examples of consulting deliverables include reports, presentations, assessments, analyses, models, plans, designs, prototypes, and training materials.

Financial services product management is a challenging role that demands industry insight and regulatory compliance expertise. The product manager oversees new product development, manages product lif

New product consulting is a service that helps inventors, startups, and small businesses bring their product ideas to life. The process involves market research, product innovation and design, and strategies for effective product launch.

Platform Product Management, a recent field, focuses on developing and managing platforms rather than individual products.

Product management methodology is a set of structured frameworks, principles, and practices that product managers and development teams use to plan, execute, and deliver products to market.

Understanding the differences between a Product Manager and a Product Owner is crucial for a successful product team. Both roles collaborate with cross-functional teams and use agile methodologies, but their focuses differ.

Creating a product roadmap is essential to any product manager’s job. A product roadmap is a high-level visual summary that outlines a product’s vision and direction over time.
Better development habits let your team deliver more value, faster. This paper explores five key habits that the team at Agilent’s Software division adopted to double their productivity and build competitive advantage in the contested market for laboratory informatics.
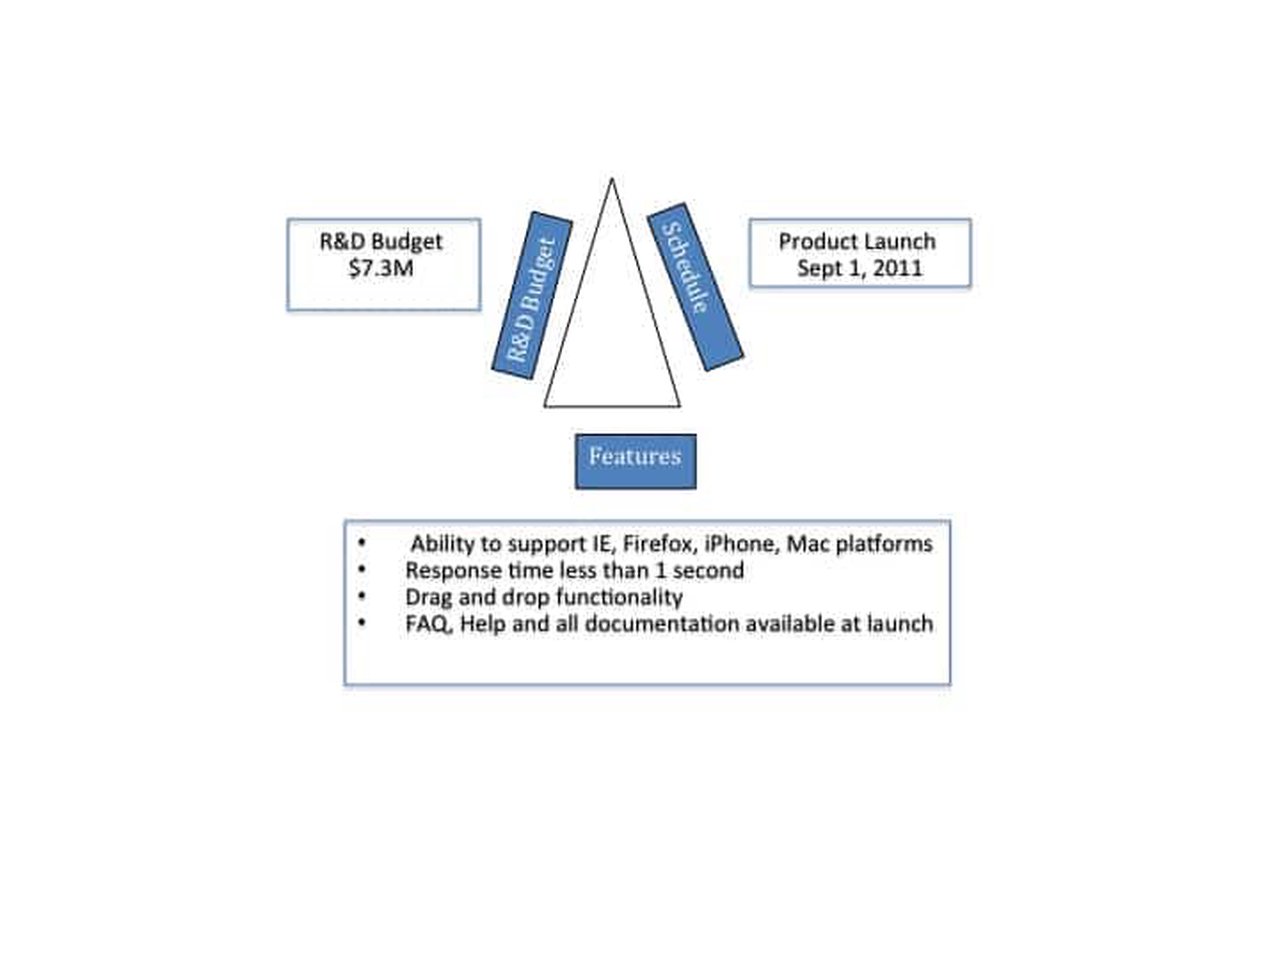
Have you made a clear decision about how to order Quality, Time, and Scope in your organization? If not, you may not be getting the results you want.
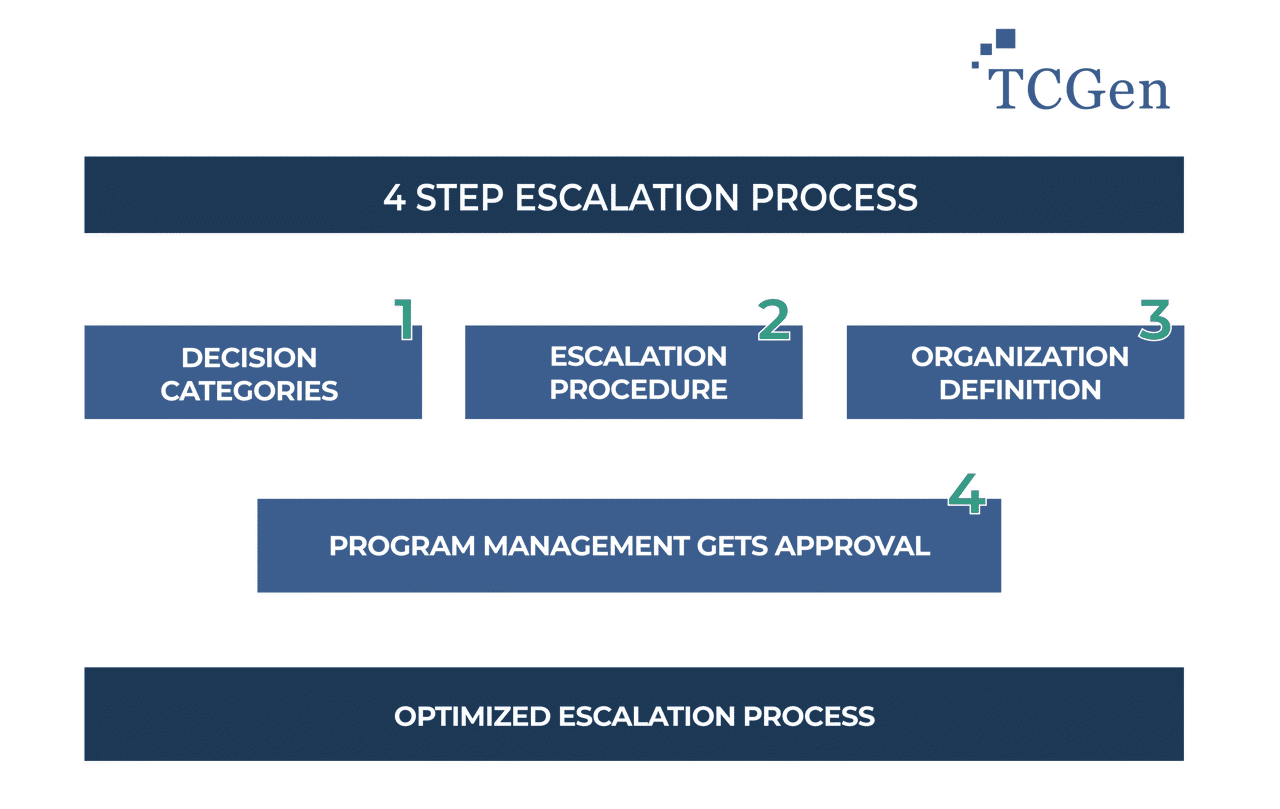
The Escalation Process clarifies the boundaries and channels of decision-making throughout an organization in order to solve the problem quickly and with clarity.
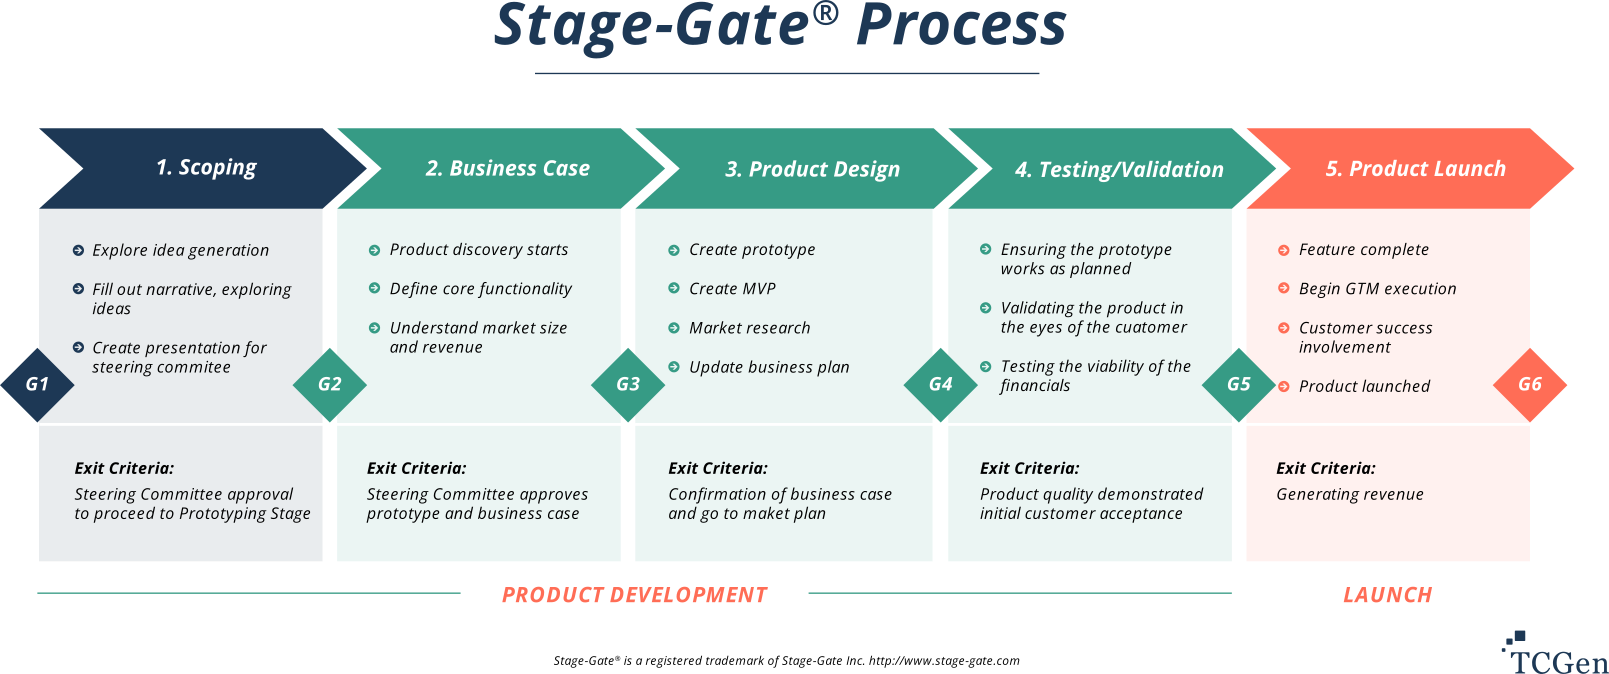
The Stage-Gate Process divides product development into 5 stages where progress to the next stage is approved at the gate.

Explore the intricacies of product management at Google. Learn how innovation and team collaboration drive the tech giant’s product lifecycle.

In 2015, we undertook a lean / agile transformation journey at Agilent Technologies that resulted in doubling our productivity over three years. Along the way we learned about teaching a large global
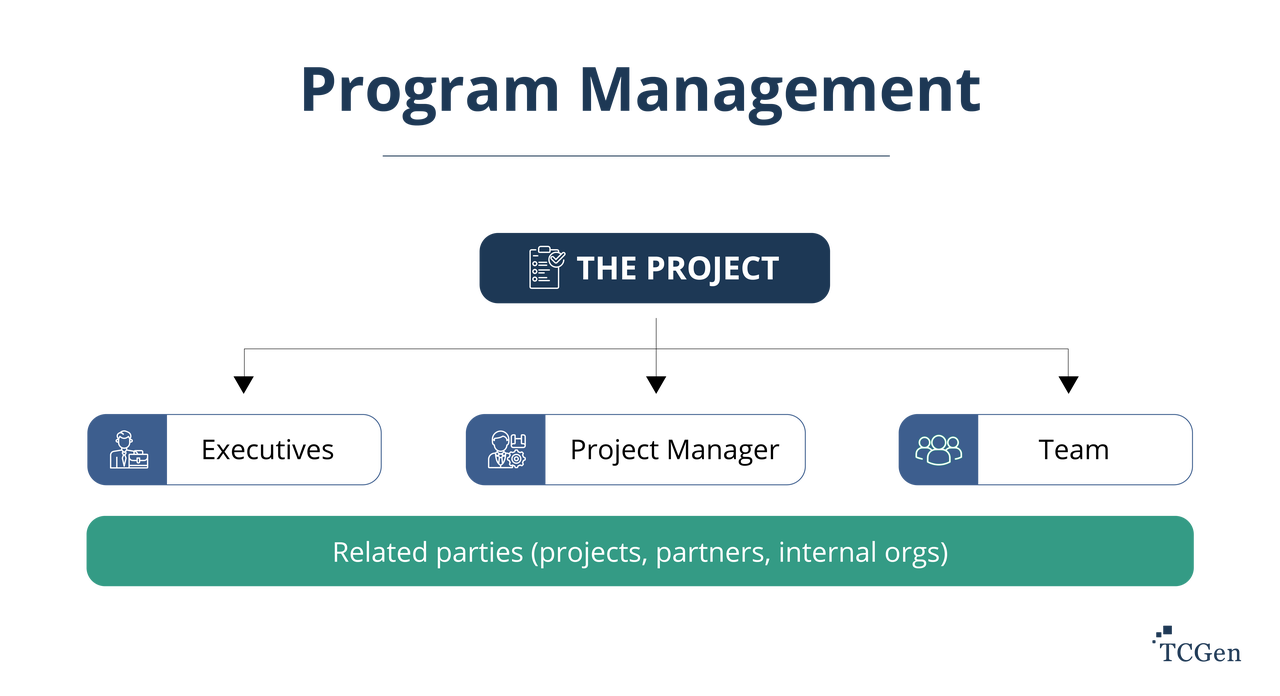
The titles of program manager and product manager sound similar, but they serve quite different functions in an organization. The skills and job title descriptions of these two professionals are distinct.
Learn what tech product management is, what’s the role of a technical product manager and what skills they have for this role in our guide.
Learn more about what product management leadership is, its foundation and its importance in our ultimate guide.
Product development life cycle describes the 4 stages of a product’s life: 1. Introduction, 2. Growth, 3. Maturity, 4. and Decline. It is fundamentally part of your product development strategy.
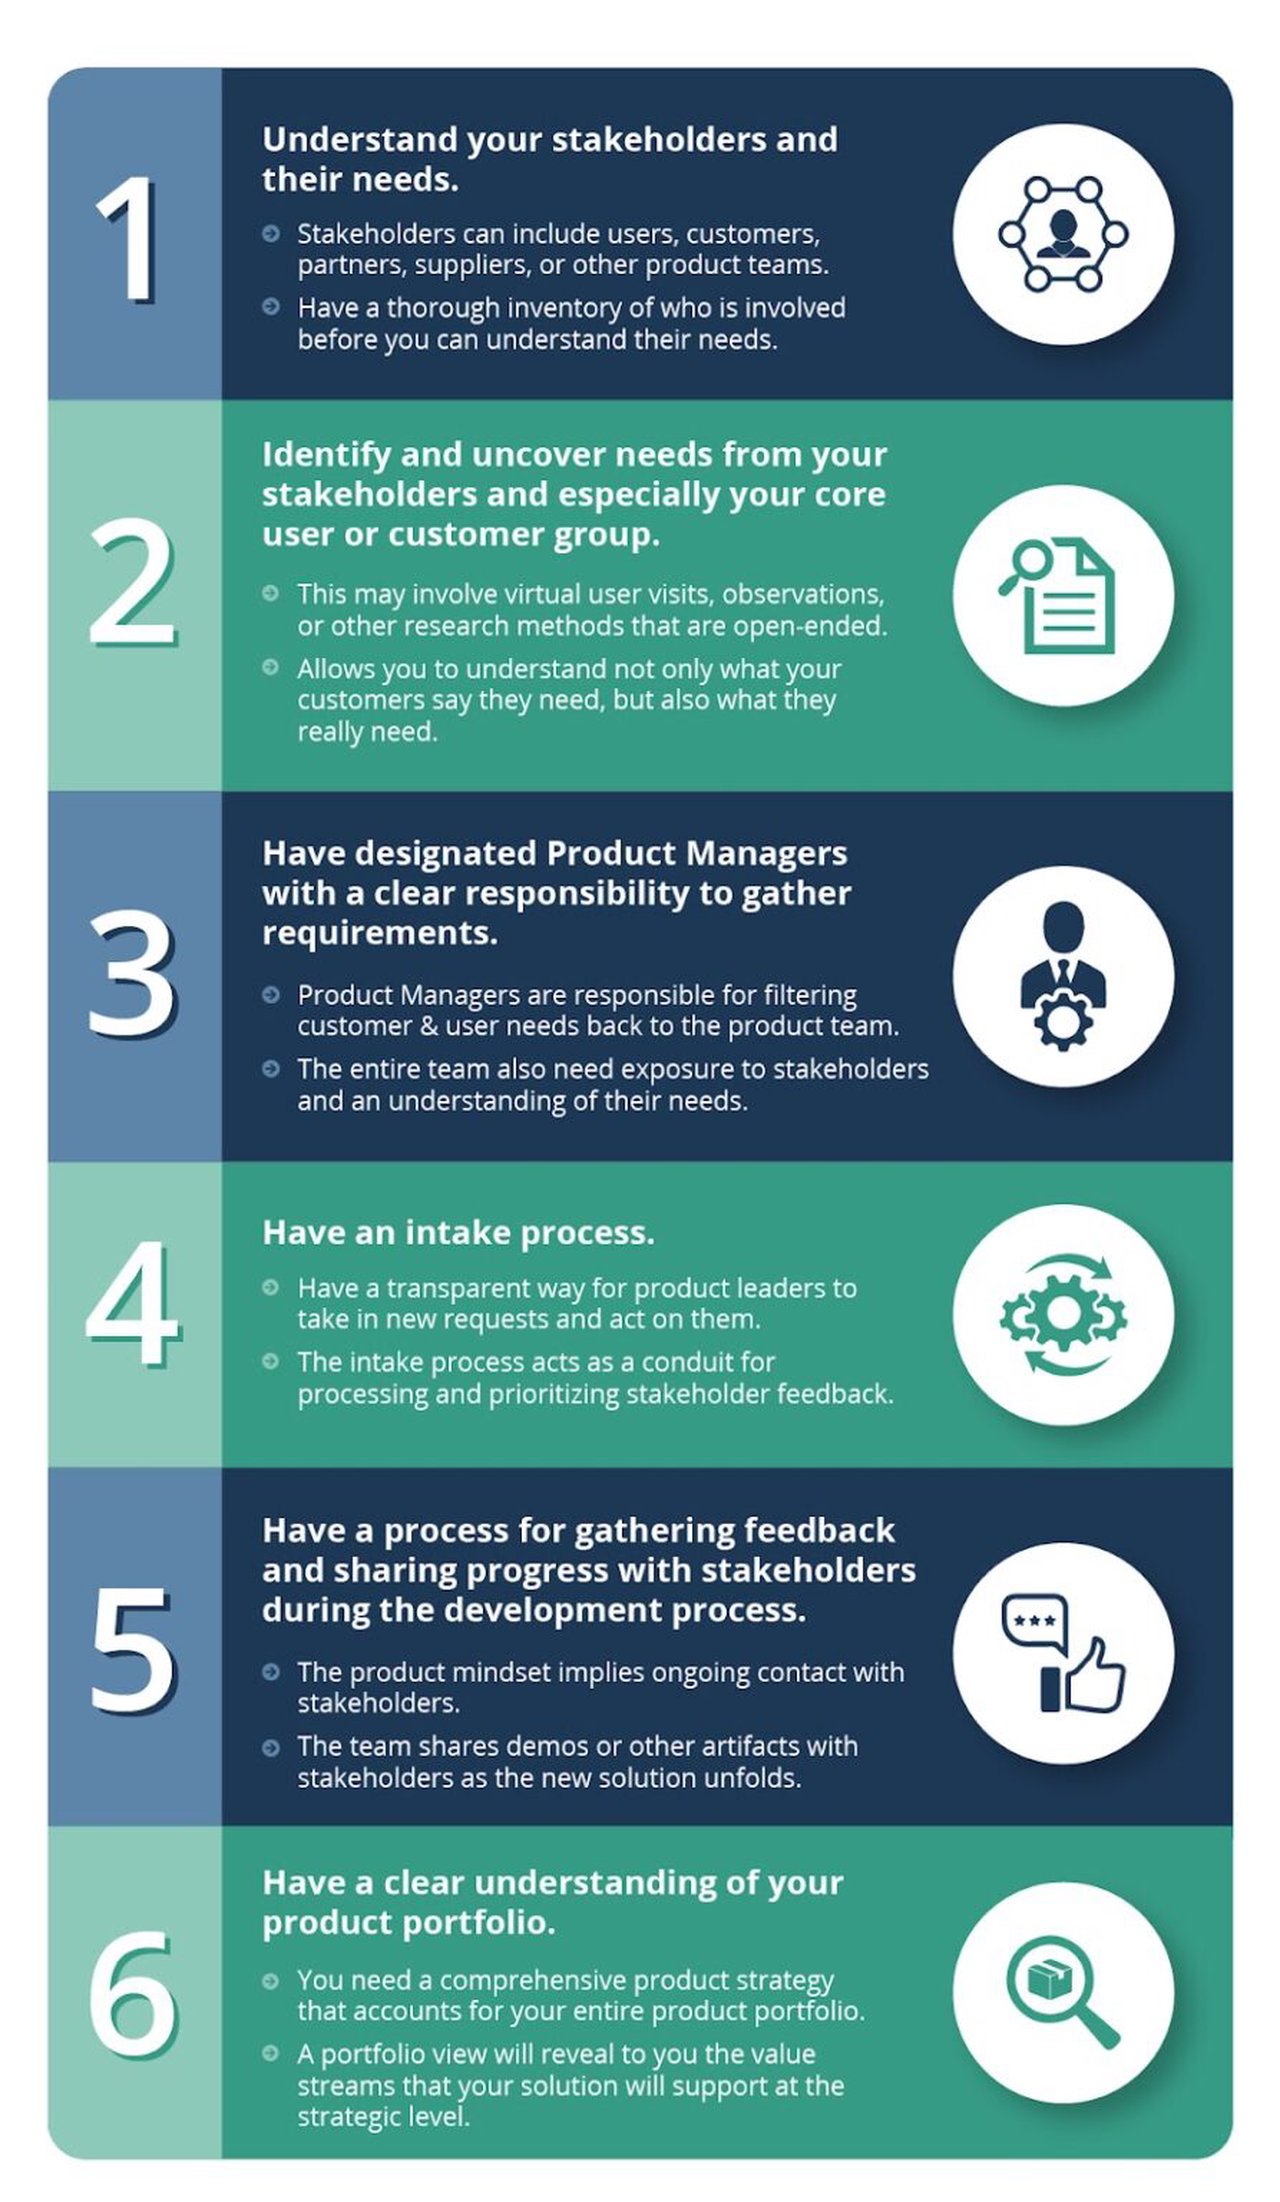
A product mindset focuses on creating stakeholder & customer value, prioritizing outcomes over output and products over projects.
Discover the essentials of Agile documentation with TCGen’s comprehensive guide. Learn the importance, process, and best practices for effective Agile documentation in software development, and how it differs from traditional methods.
Learn about the digital product development process to start creating digital products that solve customer problems, provide value, and drive profits.

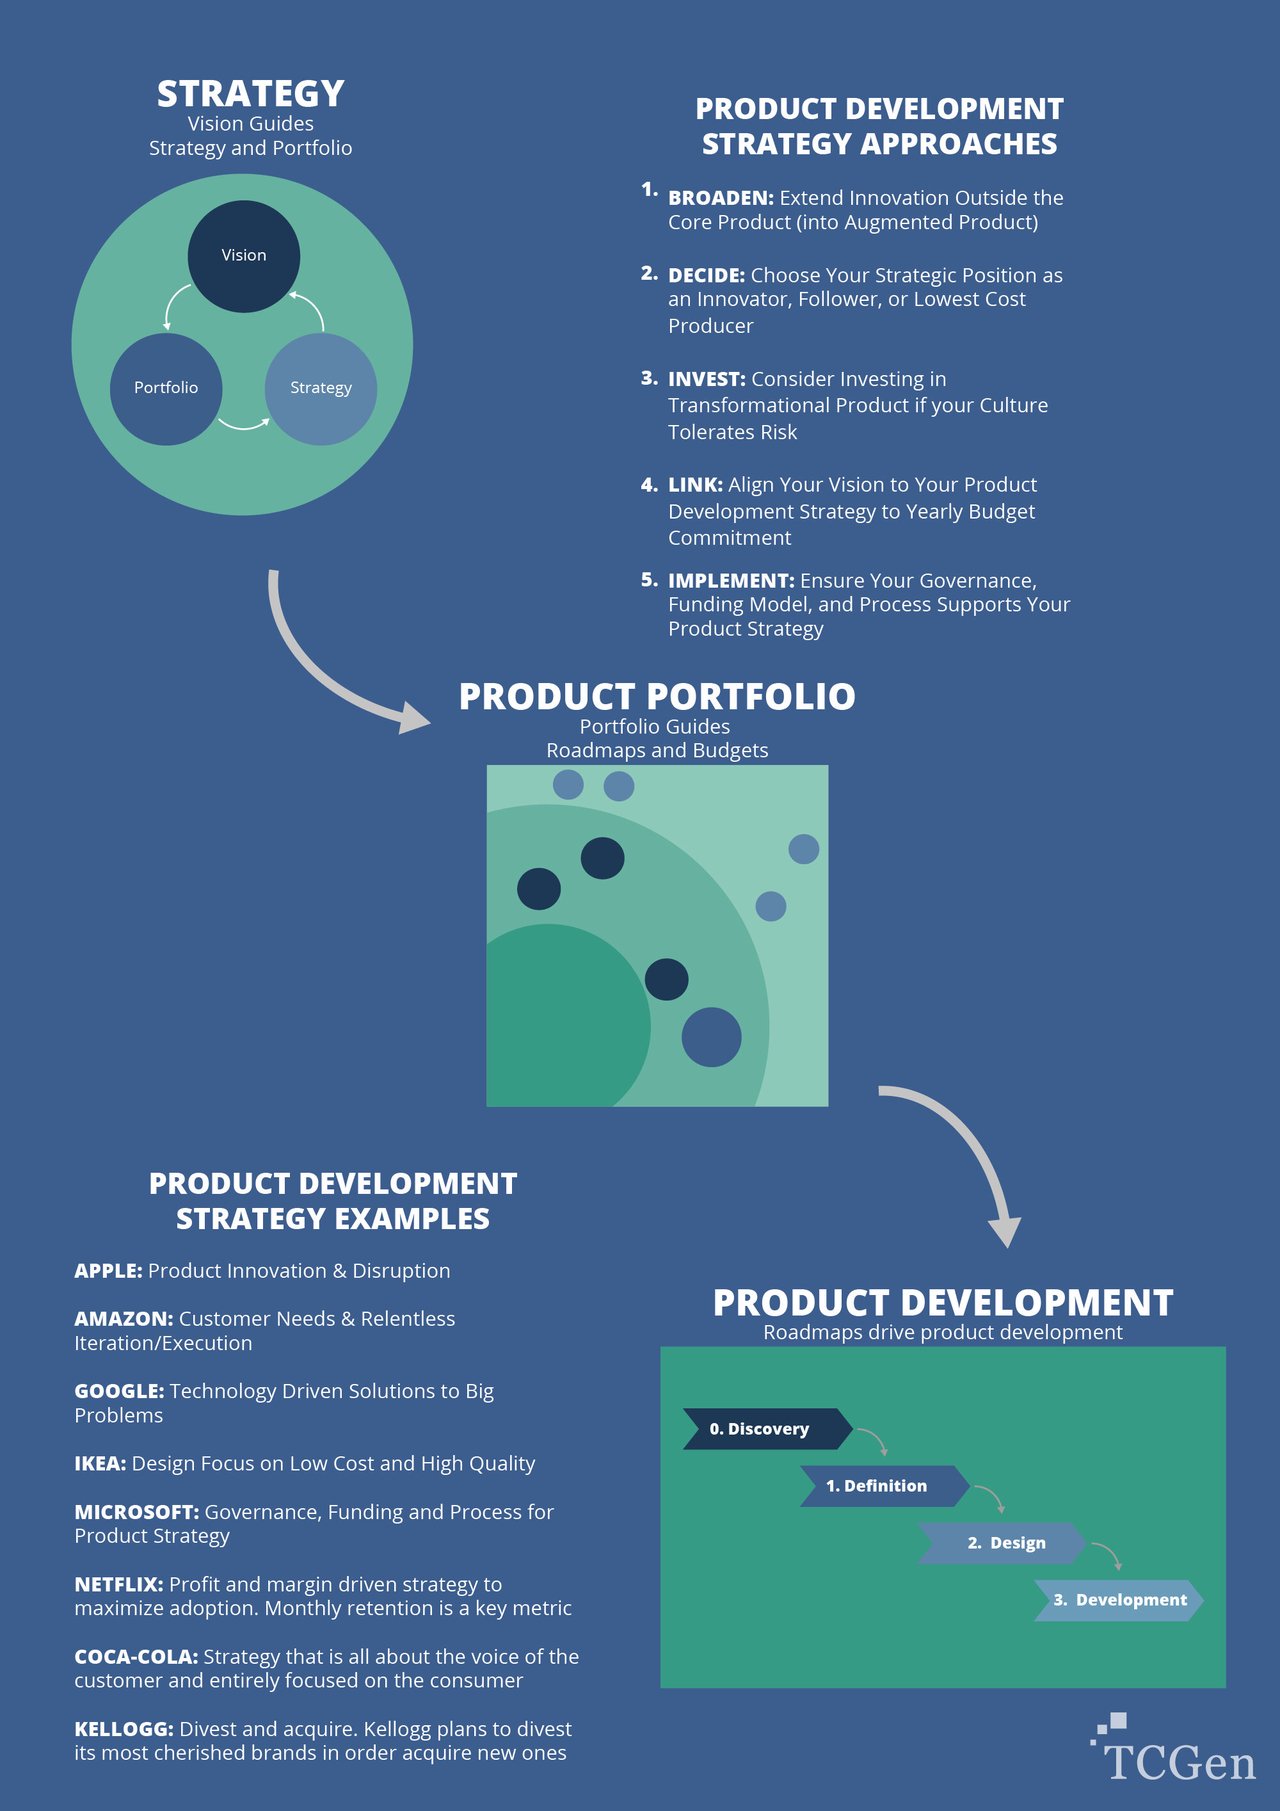
A product development strategy guides development of new products or changes to existing products to maximize sales.

Learn more on product portfolio investment map, its benefits, what business problems it solves and more in our blog post.

What is a product taxonomy? Its benefits, how it can help IT organizations, and how to create an effective taxonomy.
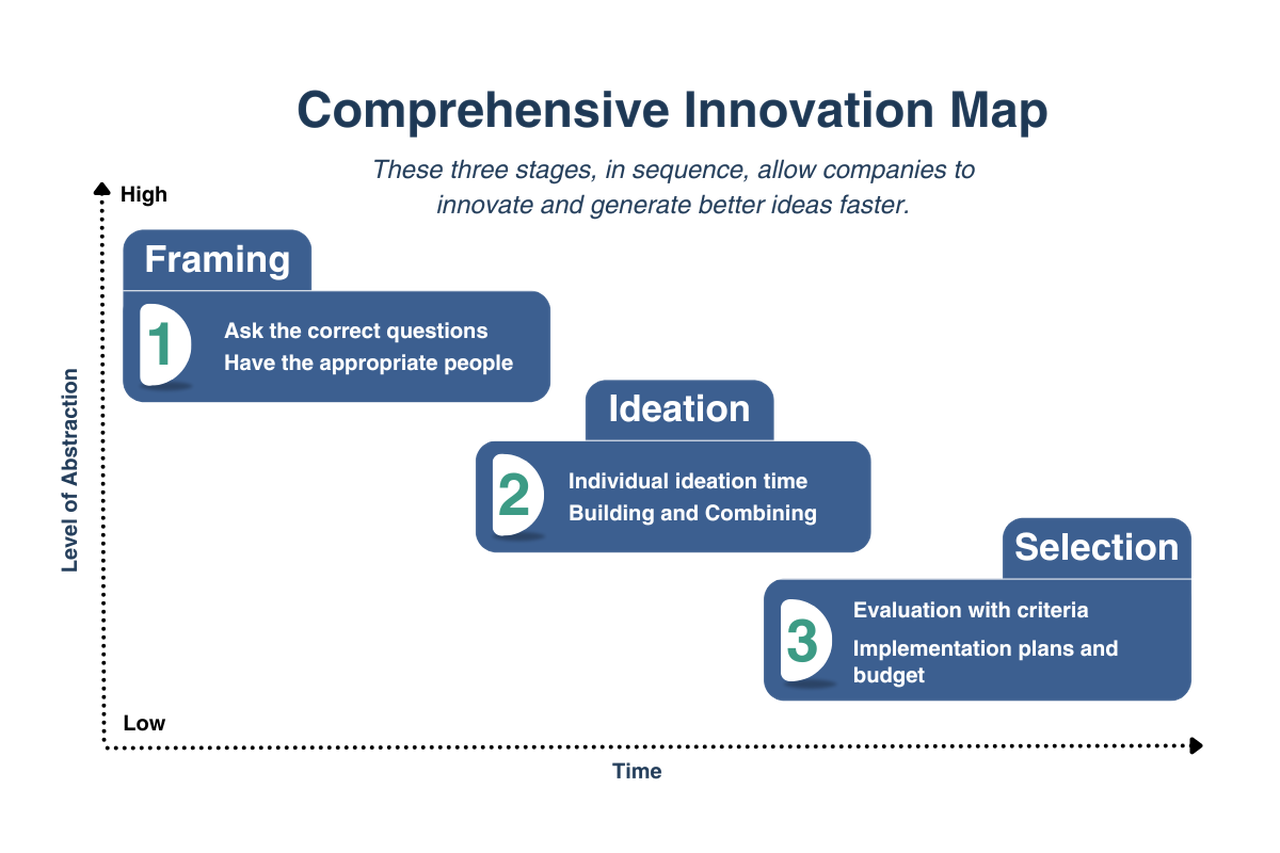
Our clients often ask us how they can become more innovative. Some seem to believe that innovation appears as if by magic. Many believe that there is no process for innovation. We have identified three innovation best practices that are research-verified, an end-to-end series of steps that yield the best ideas.
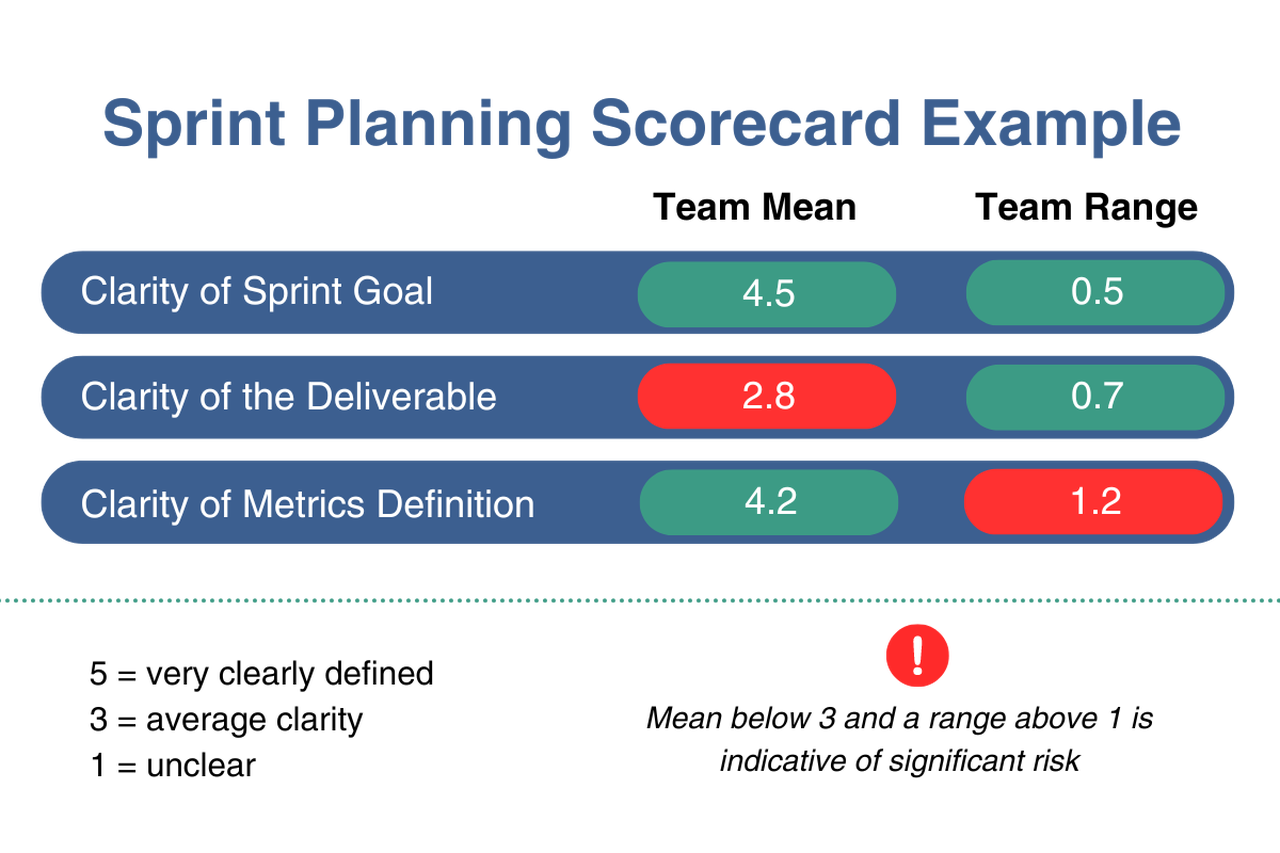
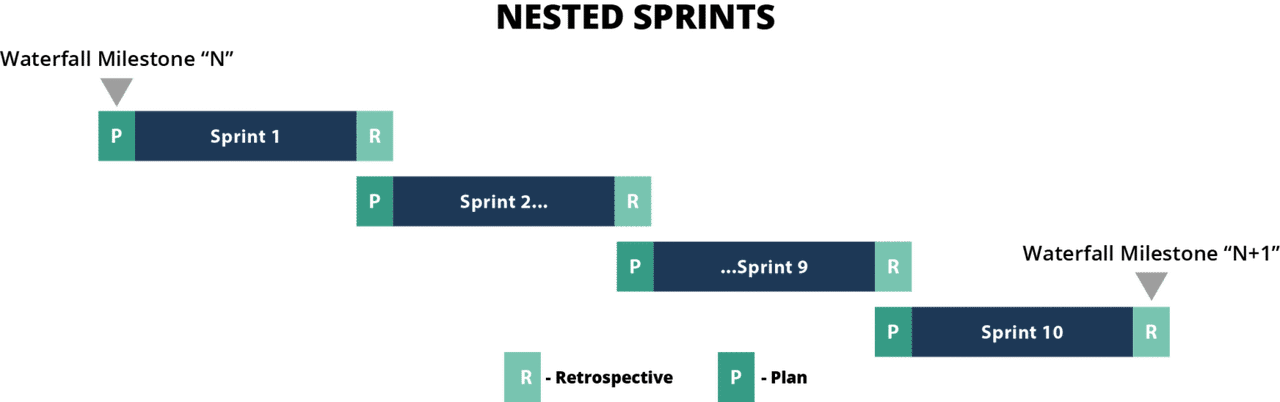
Agile is not just for software anymore. Many companies that develop tangible products – be they hardware or mixed software/hardware systems – are applying techniques, like the sprint scoreboard borrowed from Agile. By combining Agile with traditional processes, they are accelerating programs and delivering winning products.
Before projects become products, they are ideas in the minds of your teams. They begin as product concepts, germs of your company’s future growth. How can companies manage the portfolio of product ideas? They use an innovation strategic planning process.
Two of the most effective and beneficial of these practices are sprint demos. Powered by these twin aspects of Agile, development teams of all manner of products can increase accountability and make programs faster and more predictable.
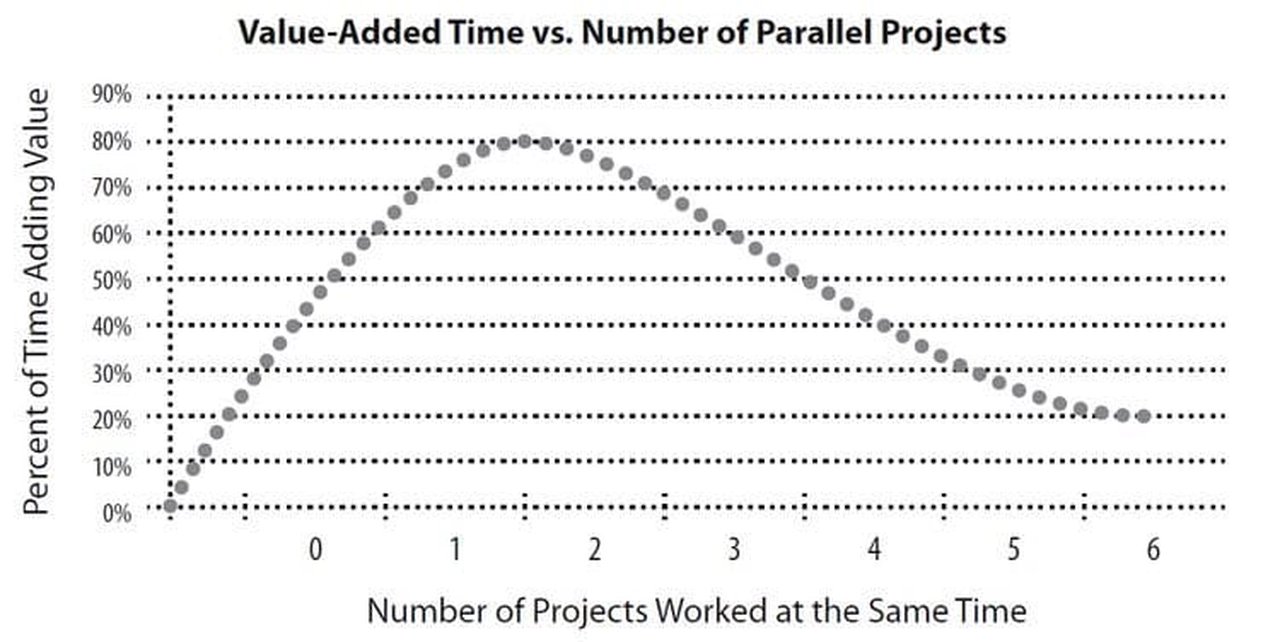
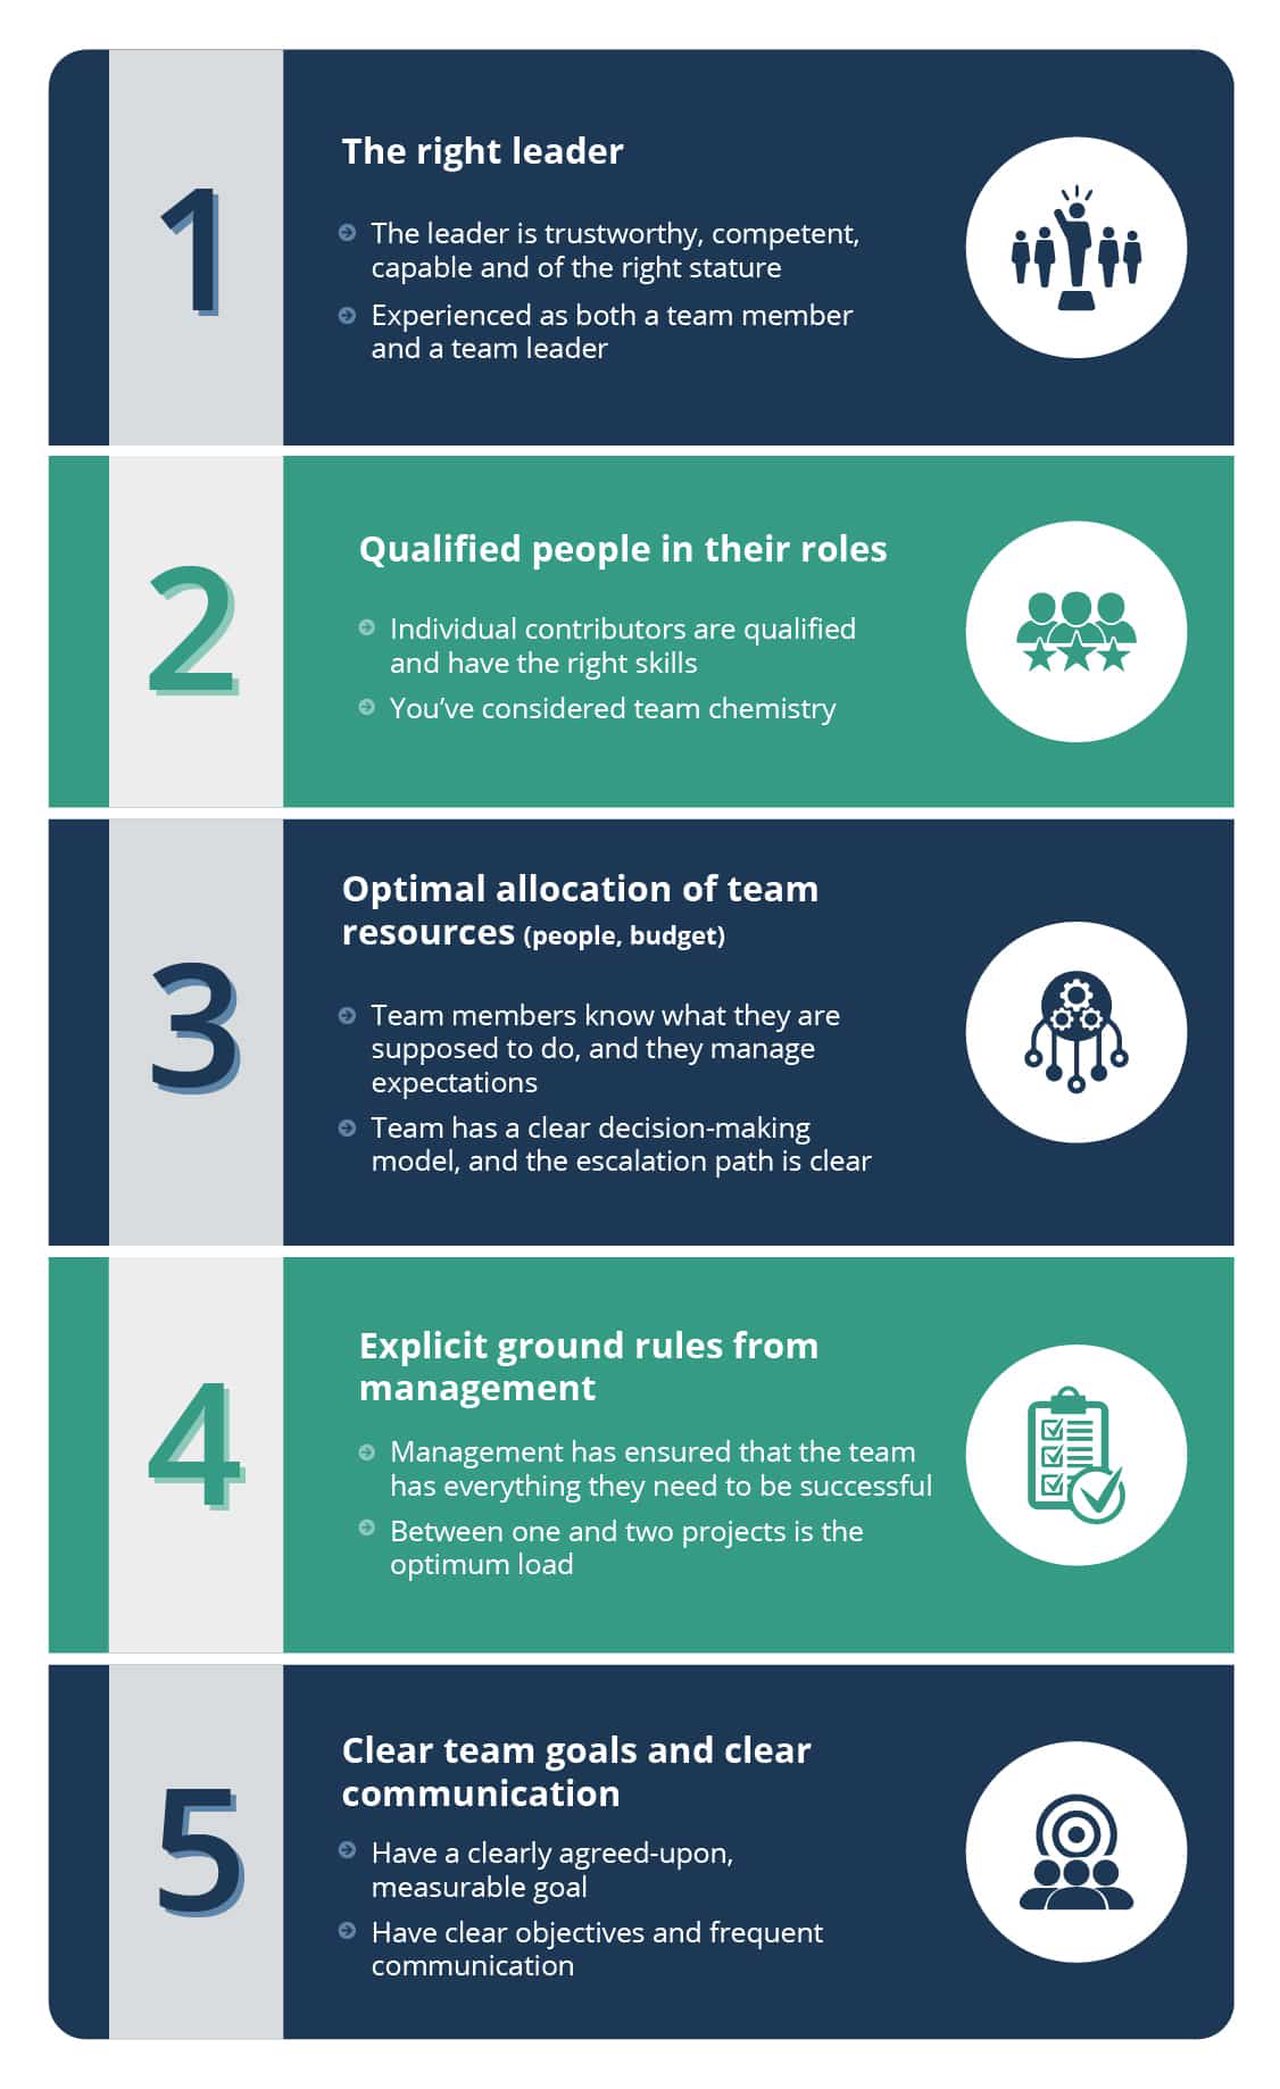
Managers want to optimize their resources by loading them up and have them do more on the priority list to satisfy the executive suite and improve project efficiency. The optimum load is approximately 2 projects – one large and one small.
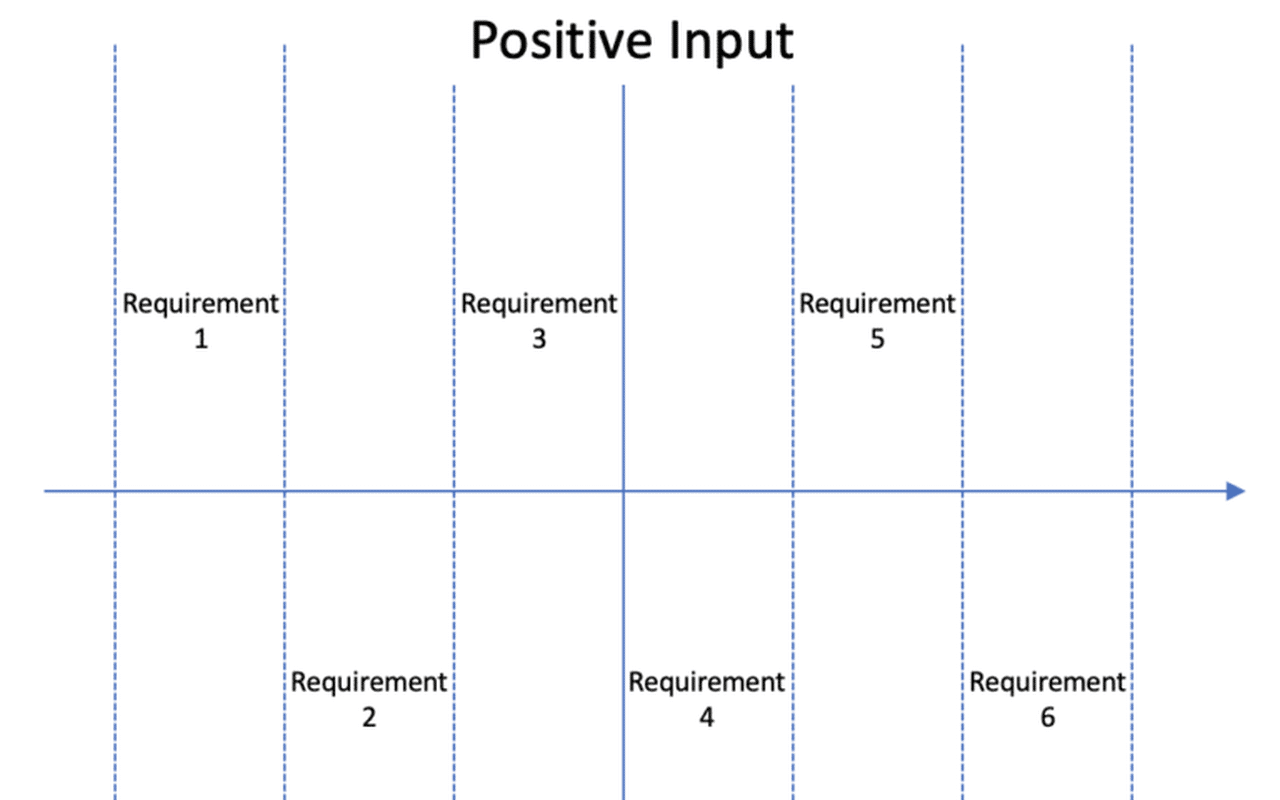
The Community Product Requirements Chart is a tool that provides customer insights and creates opportunities for innovation.
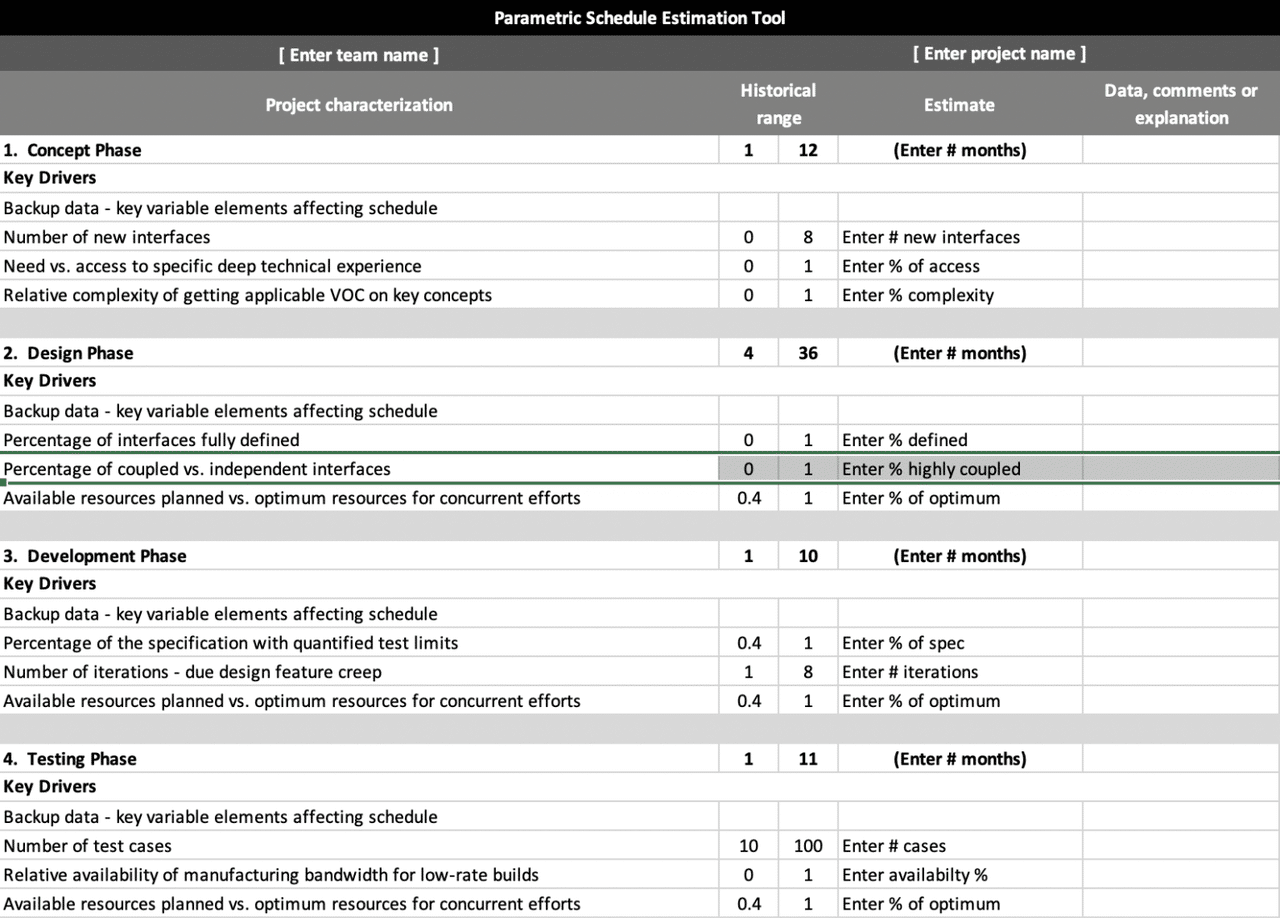
The Lite Schedule Estimating Matrix is a tool that helps to estimate the amount of time a project will take in any given phase. It leverages past experience combined with the critical few, key drivers that impact a project’s schedule.
Functional Silos lets the organizations to destroy Agile Implementation. When functional organizations do not support the transition to Agile, your implementation is defeated before it begins.
Preparation is key to a winning retrospective. The most important goals in most programs are time to market, a winning feature set, and quality. The best method is to collect the events that impacted these factors using a timeline.
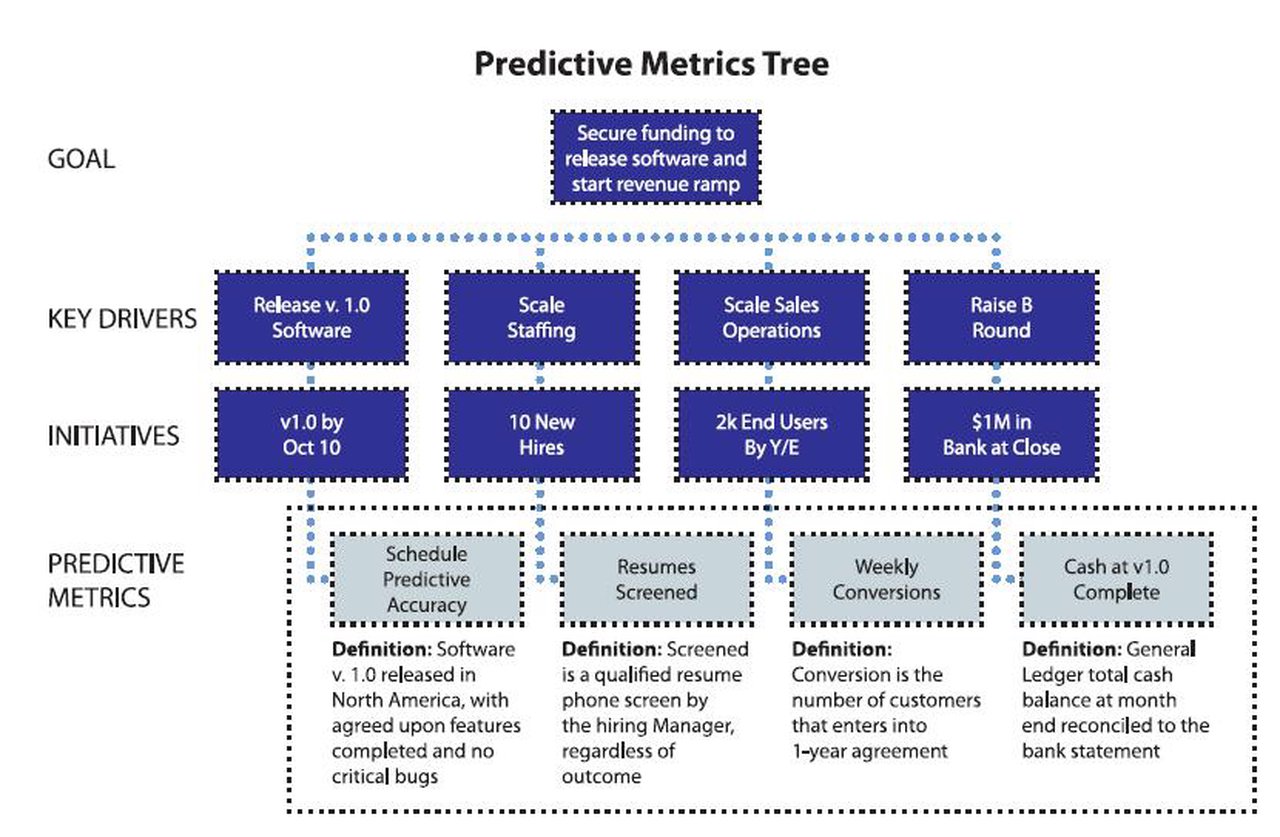
The Predictive Metrics Tree is a tool that ensures that what you’re measuring helps you achieve your program goals. Learn to create Predictive Metrics Tree.
Setting “project boundaries and conditions” at the time of a project’s approval is an effective way to create a “contract” between the management and project teams.
Organizations are failing to take a stake in improving productivity in engineering, a core process that is the engine of top-line growth.
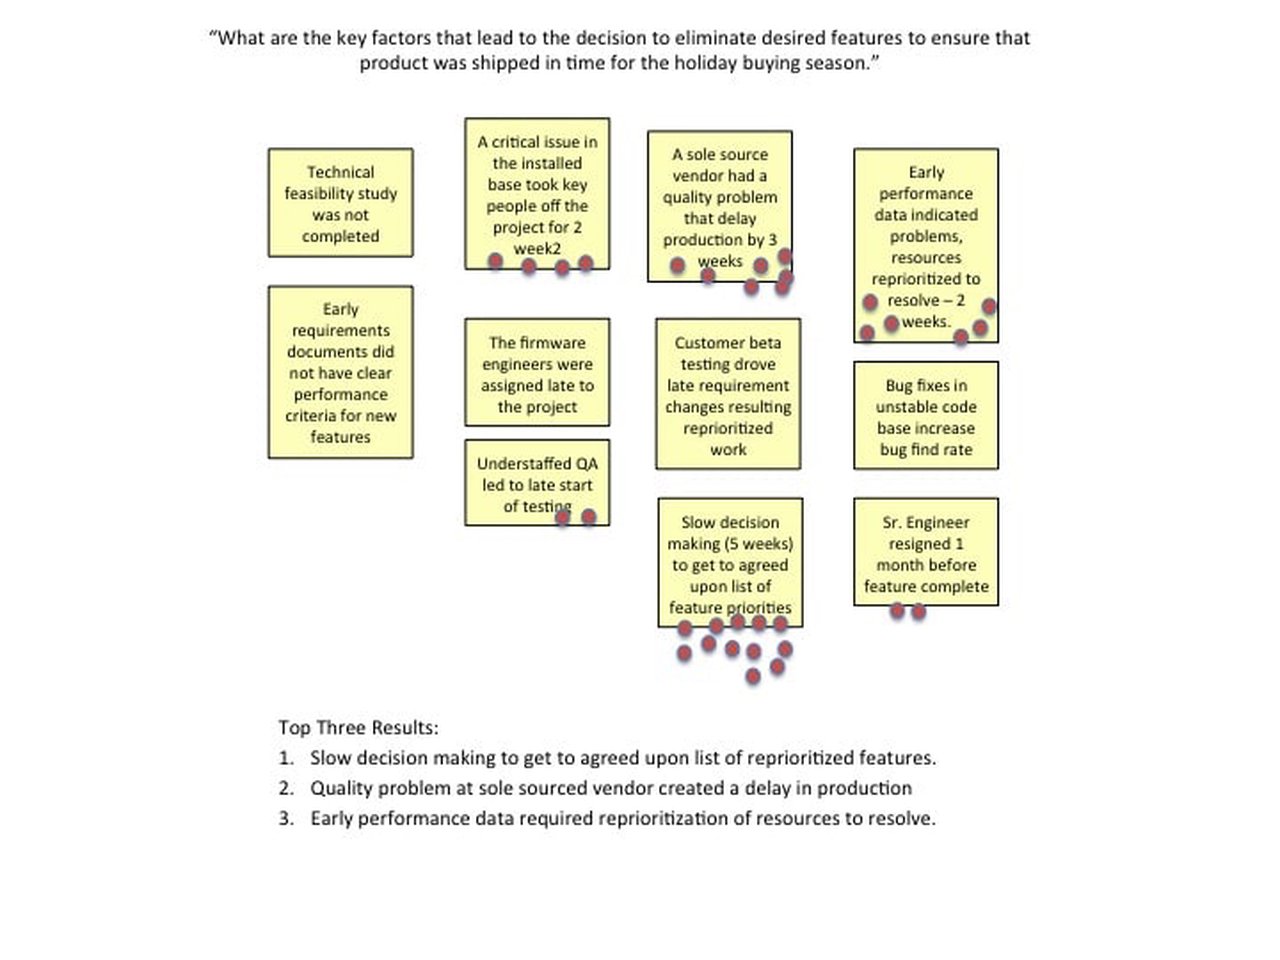
Dot Voting is a process in which a team can take a large amount of data and quickly gain focus on the most relevant elements based on the team’s shared analysis.
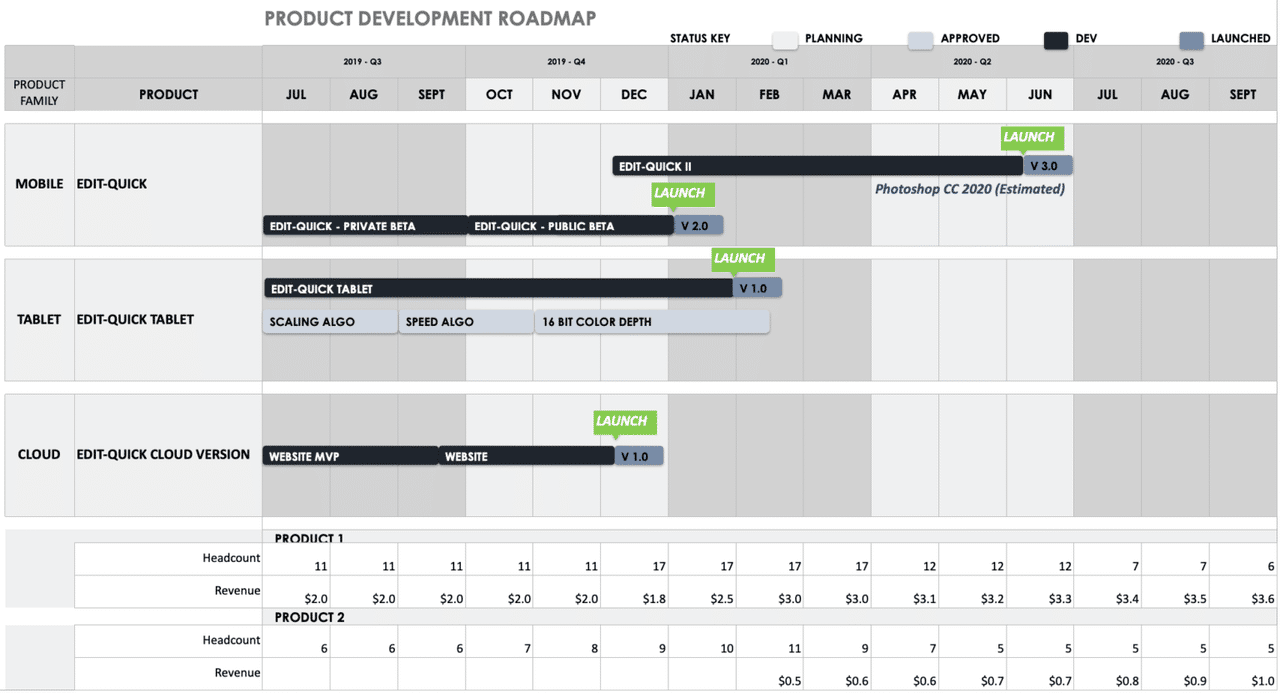
Learn what product development roadmap is, its benefits, pitfalls and much more in our ultimate guide on product development roadmap.

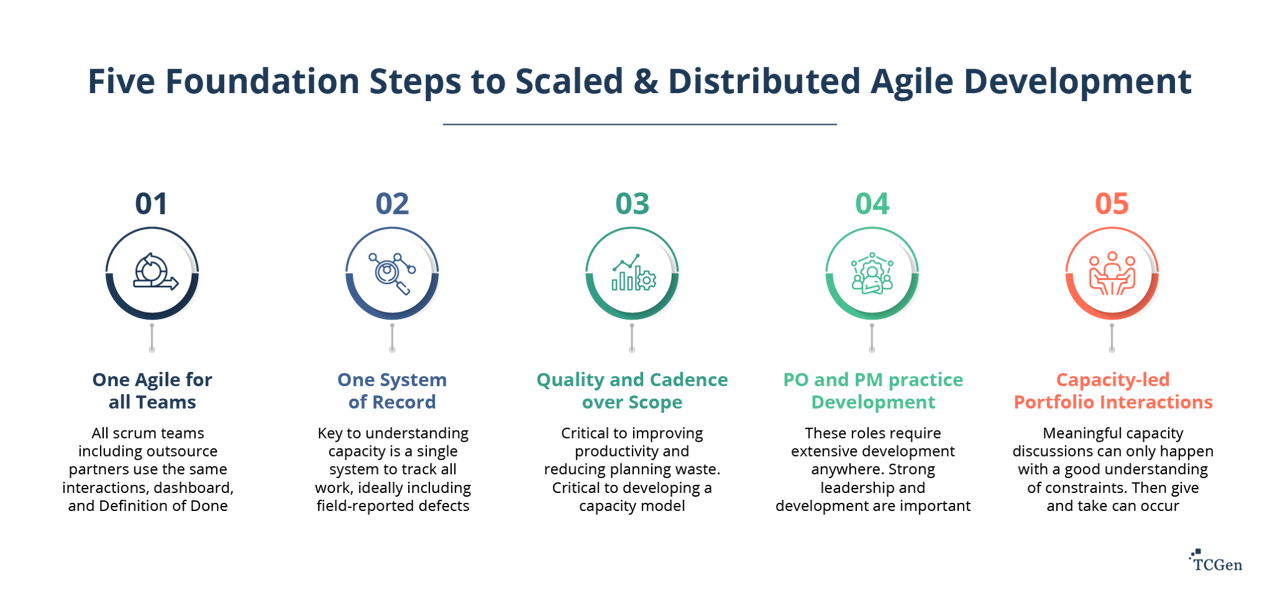
Agile Intelligence Scaled Agile Consulting for Leaders Are you looking to transform your organization's software development practices to deliver value faster and more effectively? We have helped some
![New product introduction process [NPI] in steps](/wp-content/uploads/2021/06/new-product-introduction-steps_hu_320232039087476a.jpg)
The new product introduction process is a set of repeatable steps or stages a company uses to realize the new product to satisfy a market need.
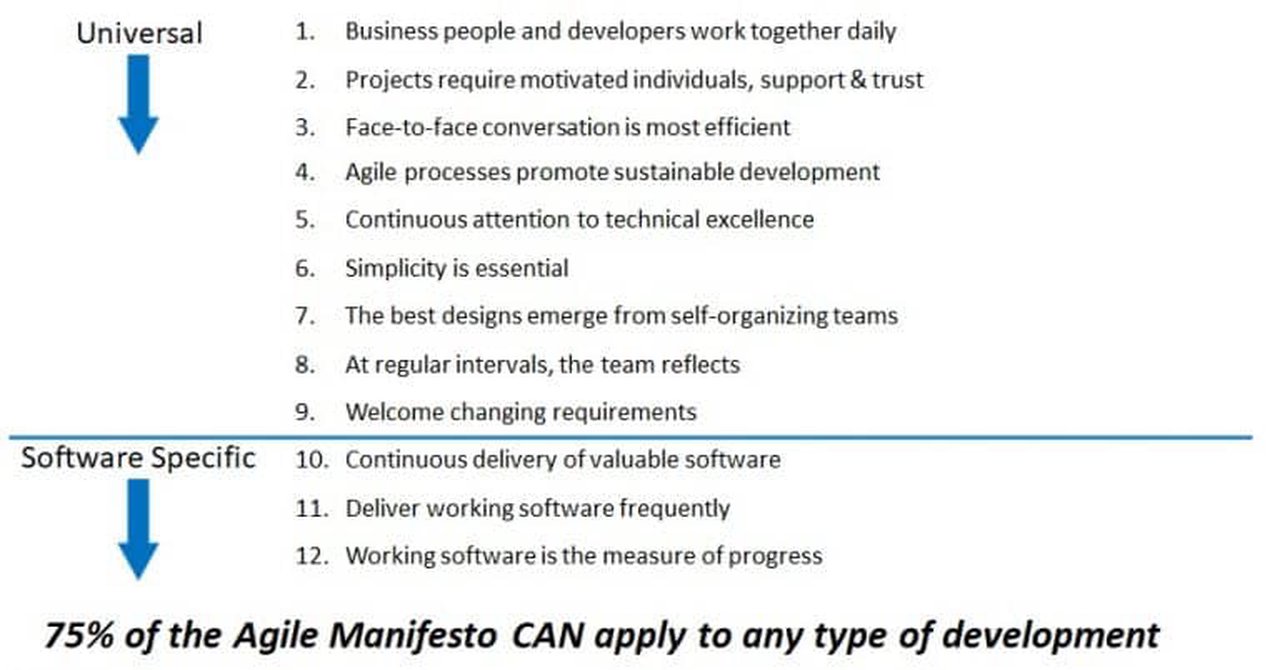
Of 12 Agile principles contained in the Manifesto, 75% are not specific to agile software development projects.
Agile estimation techniques are crucial for effective project management. Master these five methods to streamline your team’s workflow and achieve project success.
Maximize the success of your Agile project with these four crucial Agile ceremonies: Sprint Planning, Daily Scrum, Sprint Review, and Sprint Retrospectives.
Learn how to create an Agile work culture that fosters innovation and empowers your team to give better results.
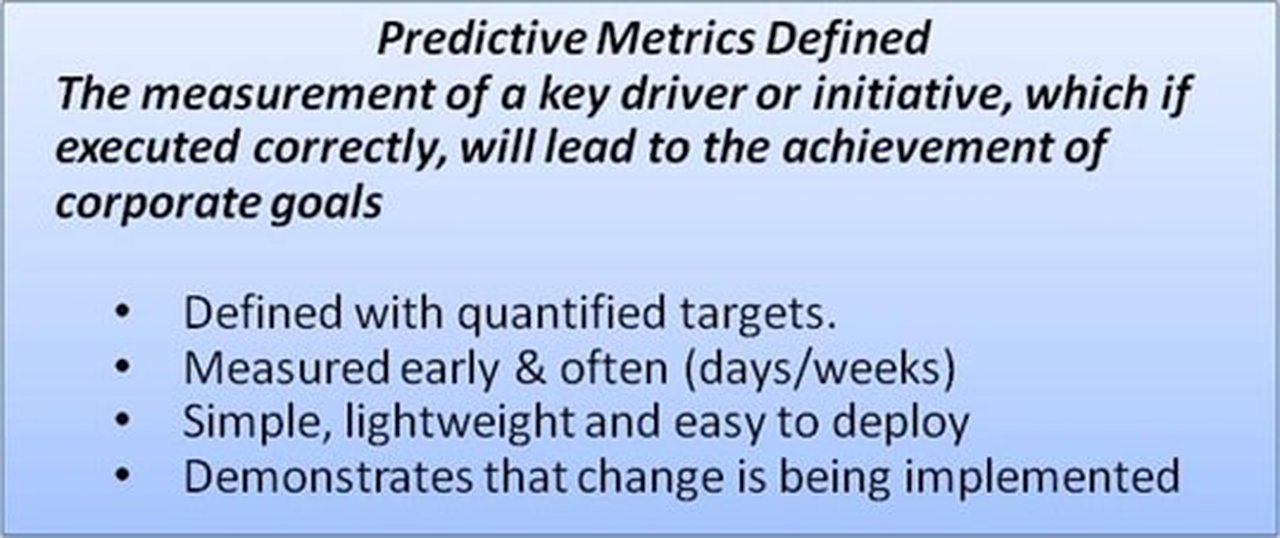
Companies are producing the wrong results, because they’re measuring the wrong things. If you want to ensure long–term success use short-term predictive metrics to quickly inform you that you’re on the right path.
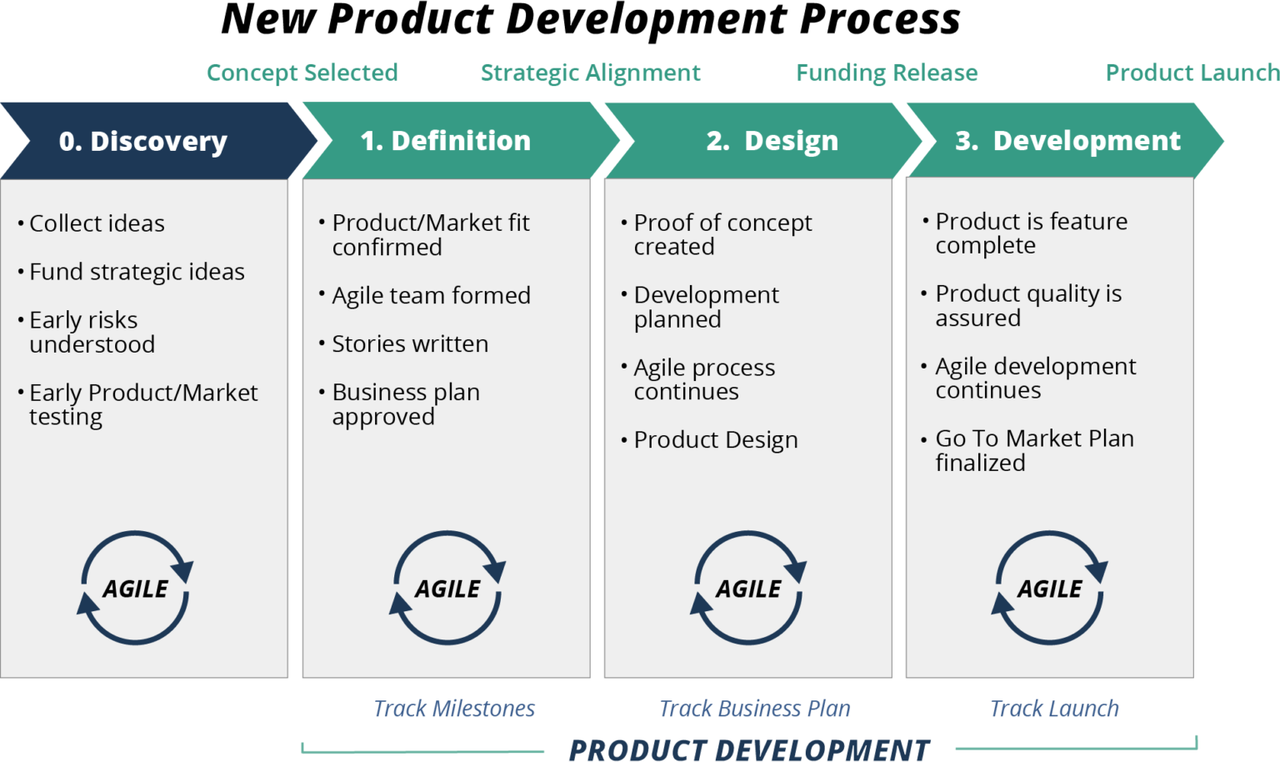
A new product development process is a series of stages to turn an idea into a product that satisfies customer needs.
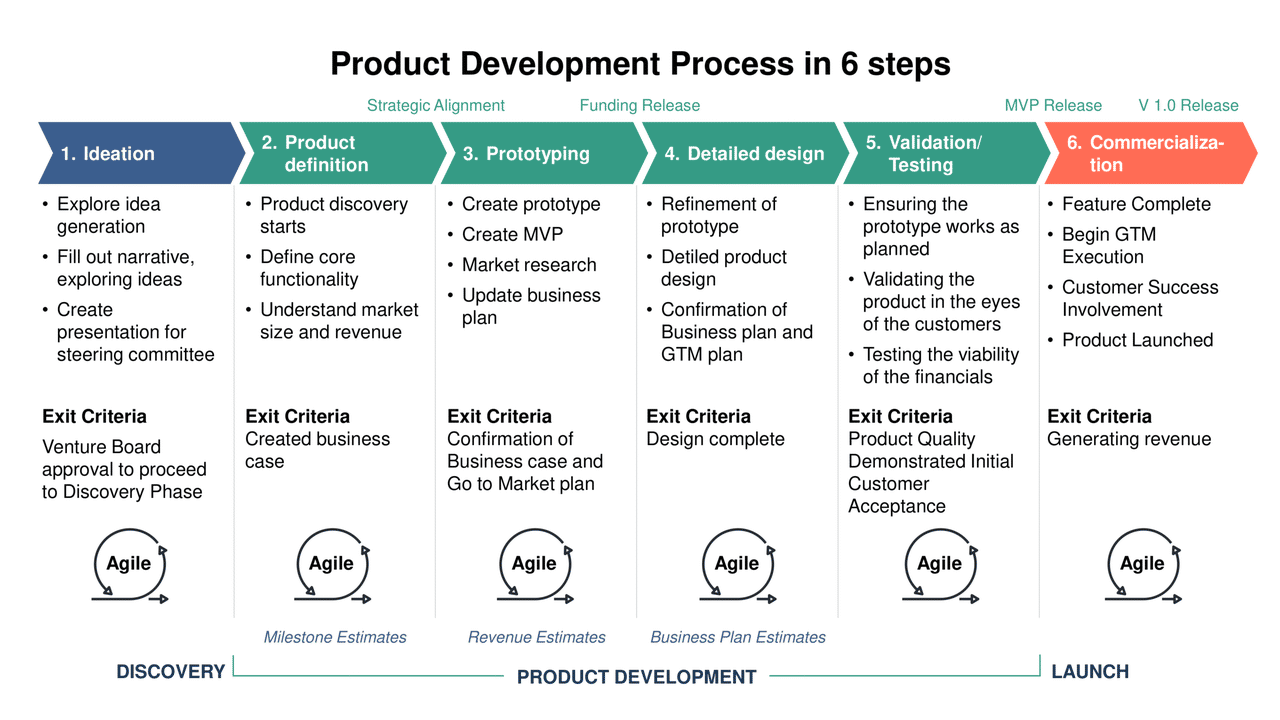
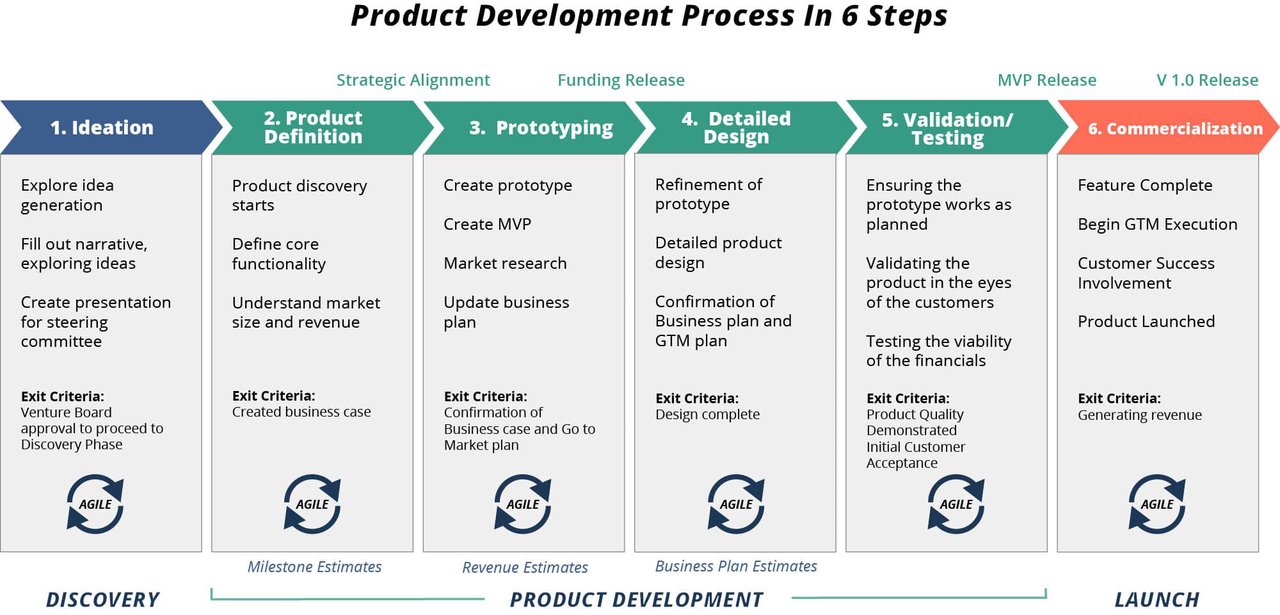
![Product Development [Explainer] Definition and Examples | 2024](/wp-content/uploads/2022/12/Agile-Product-Development-Methodology_hu_1e3f11fd9090a15c.png)
Agile Product Development enables companies to develop products quickly and respond rapidly to change involving self managing teams.

Product discovery can be a significant investment for any company. Before you launch a team into the discovery process, ensure that the idea is one where you can win and that it is worth it.
Understand the medical product development process to create medical devices from scratch to finish, get regulatory approval, and drive profits to your business.
Learn what software product development is and how to make successful software products using a tried-and-tested process with the Agile and Waterfall approach.
Product development KPIs, or key performance indicators, are specific product management metrics that track and monitor business goals and give vital insights into the product development process.
Creating a new and innovative food product follows a complex process. In this post, we explore how to create a successful food product step-by-step in 2023.
Learn what cosmetic product development is & identify opportunities to create your successful beauty product lineup while gaining a competitive advantage.
Learn about engineering product development and the role of product engineers in creating high-value products
Discover the electronic product development process to create quality hardware, scale operations, and drive profits.
Discover the difference between market development and product development to help implement the right growth strategy for your business
Learn about pharmaceutical product development. Create innovative drugs for customers to gain a competitive edge.
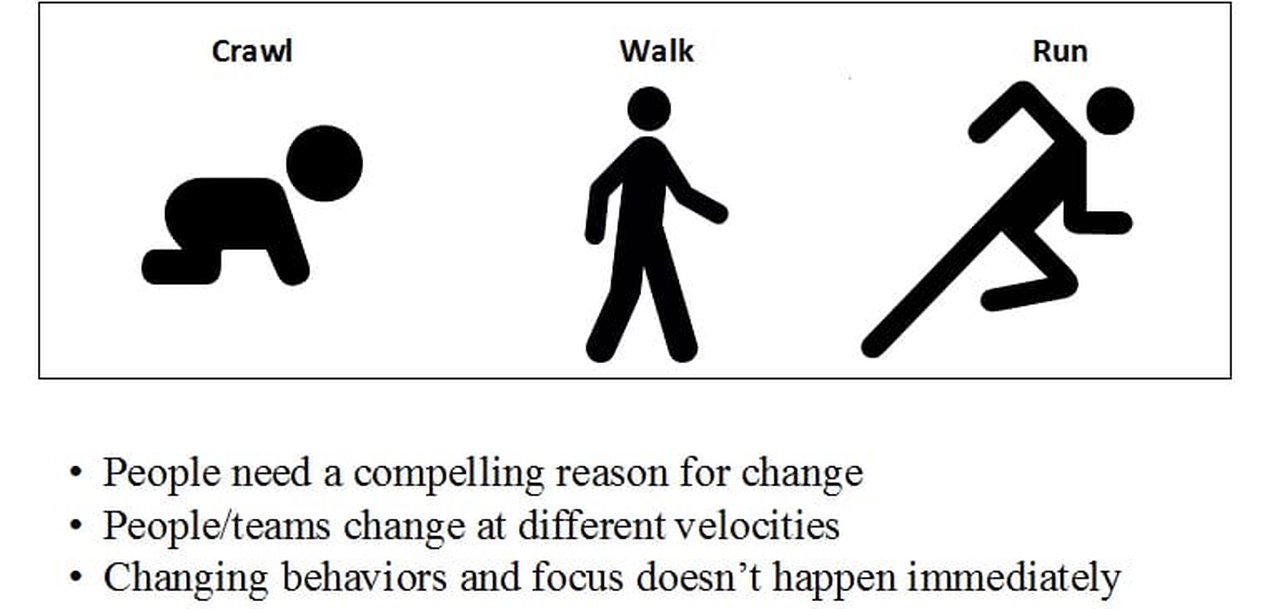
Traditional change management is becoming obsolete. Discover agile change management and how it helps keep organizations on top of ever-changing demands.
Move away from traditional performance management and achieve true agility by implementing an agile approach to performance management for your business.
Get a deeper understanding of the fashion product development process to create better products consistently and skyrocket your fashion business growth.
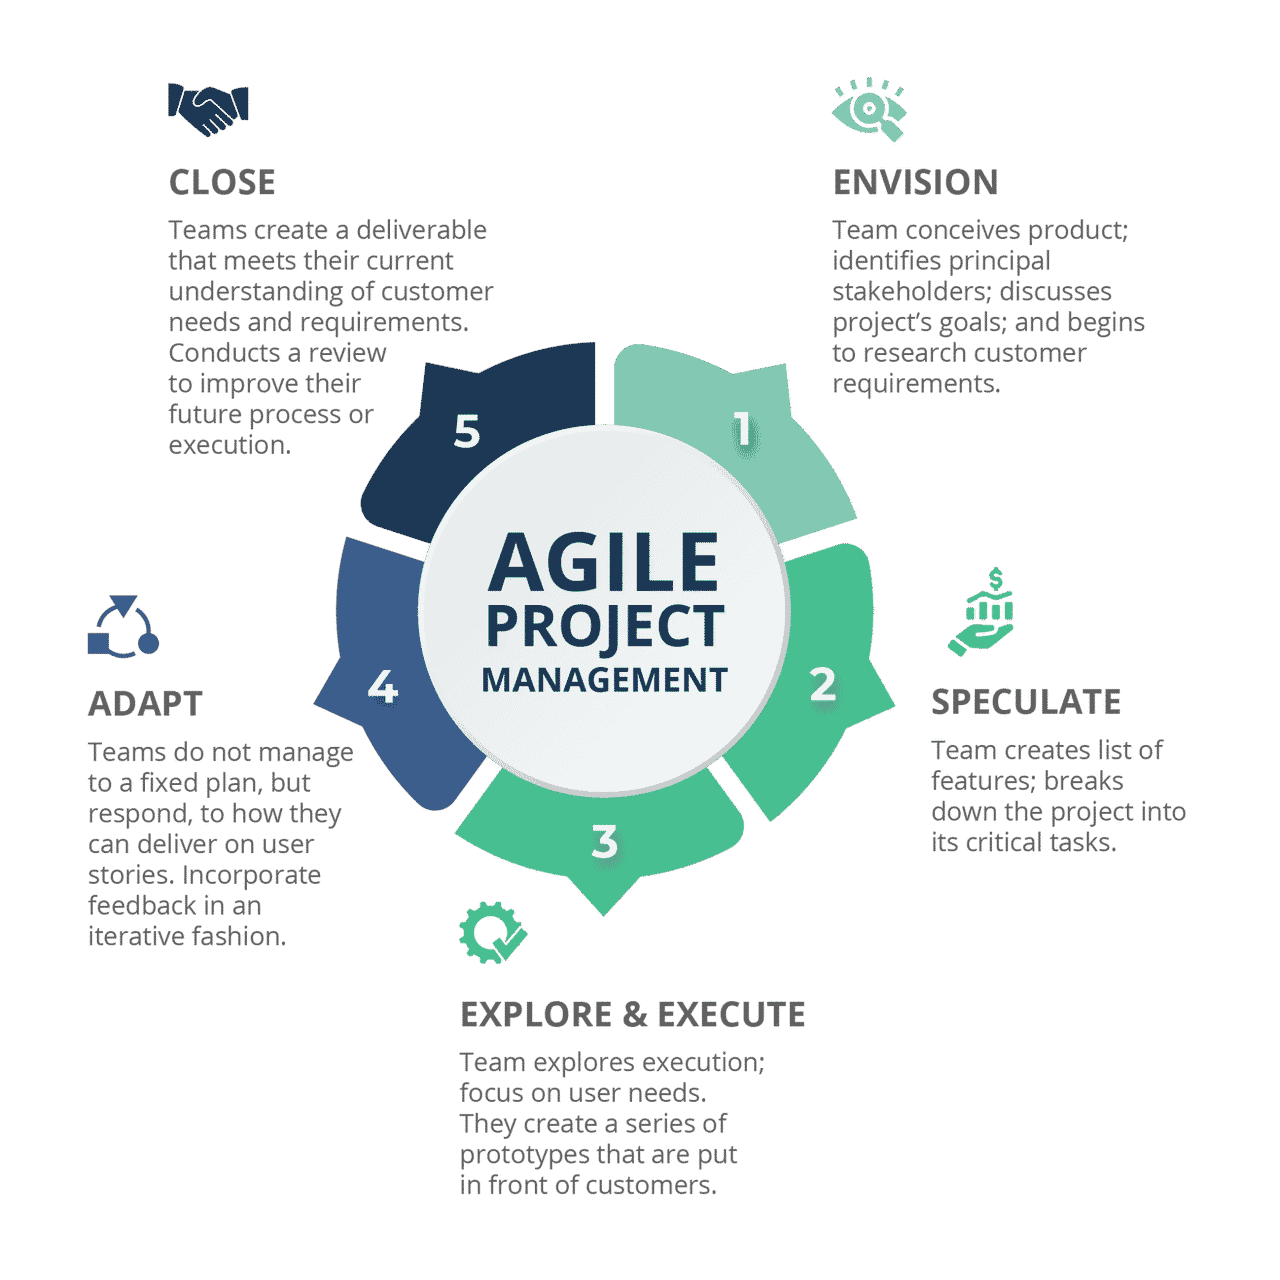
Are you wondering what is agile project management and when we use it? In this post, you will learn everything there is to know regarding agile project management.
Agile project management can help streamline construction processes and reduce delays. In this article, we explore how to be agile in the construction industry.
A responsibility assignment matrix is a technique for arranging agile team roles. It outlines the responsibilities of each team member by tagging them with one of four labels as follows: R for responsible, A for accountable, C for consulted, and I for informed (RACI). Project managers use RAM to guide scrum teams.
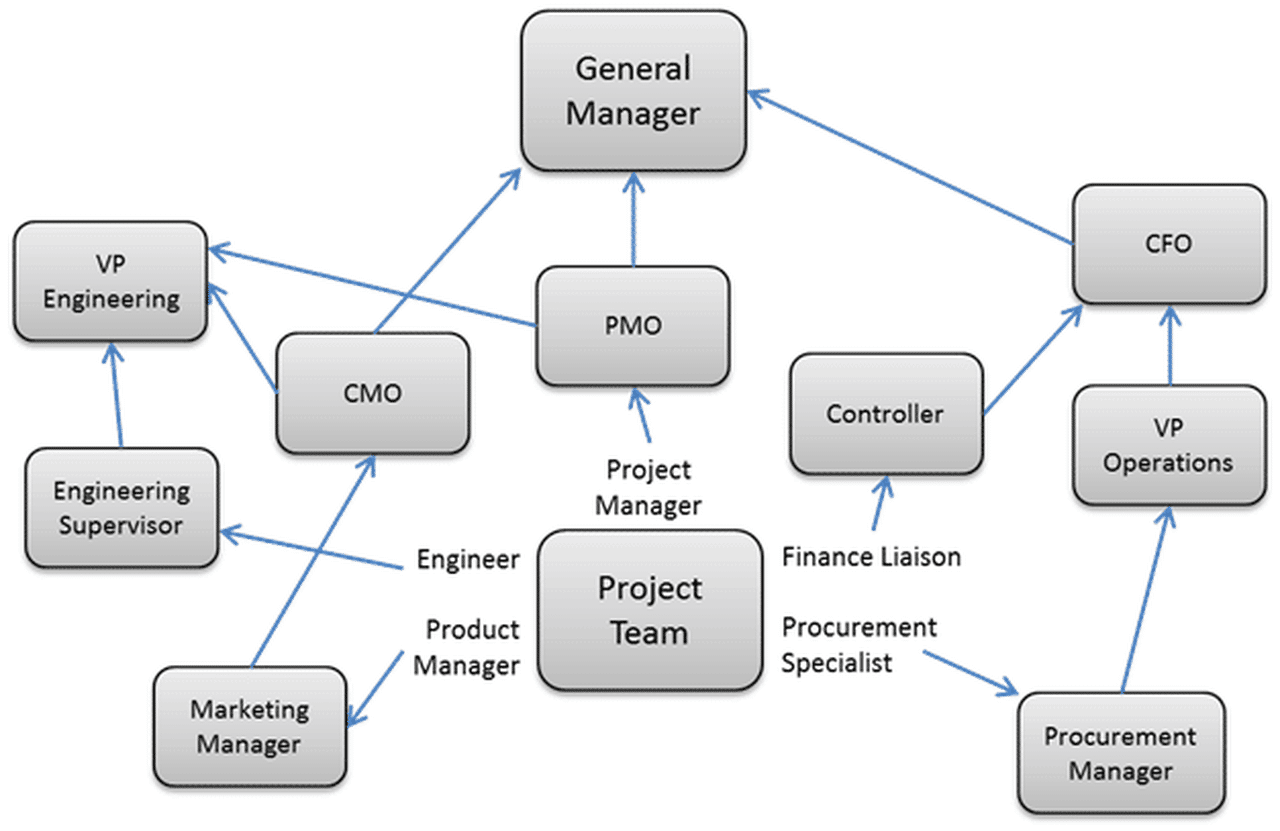
Cross functional team example, using a core team model. Plus five tips for success with cross functional teams.

Design thinking is about product development. In new product development, it is a means to direct and focus innovation that drives growth in sales and profits.
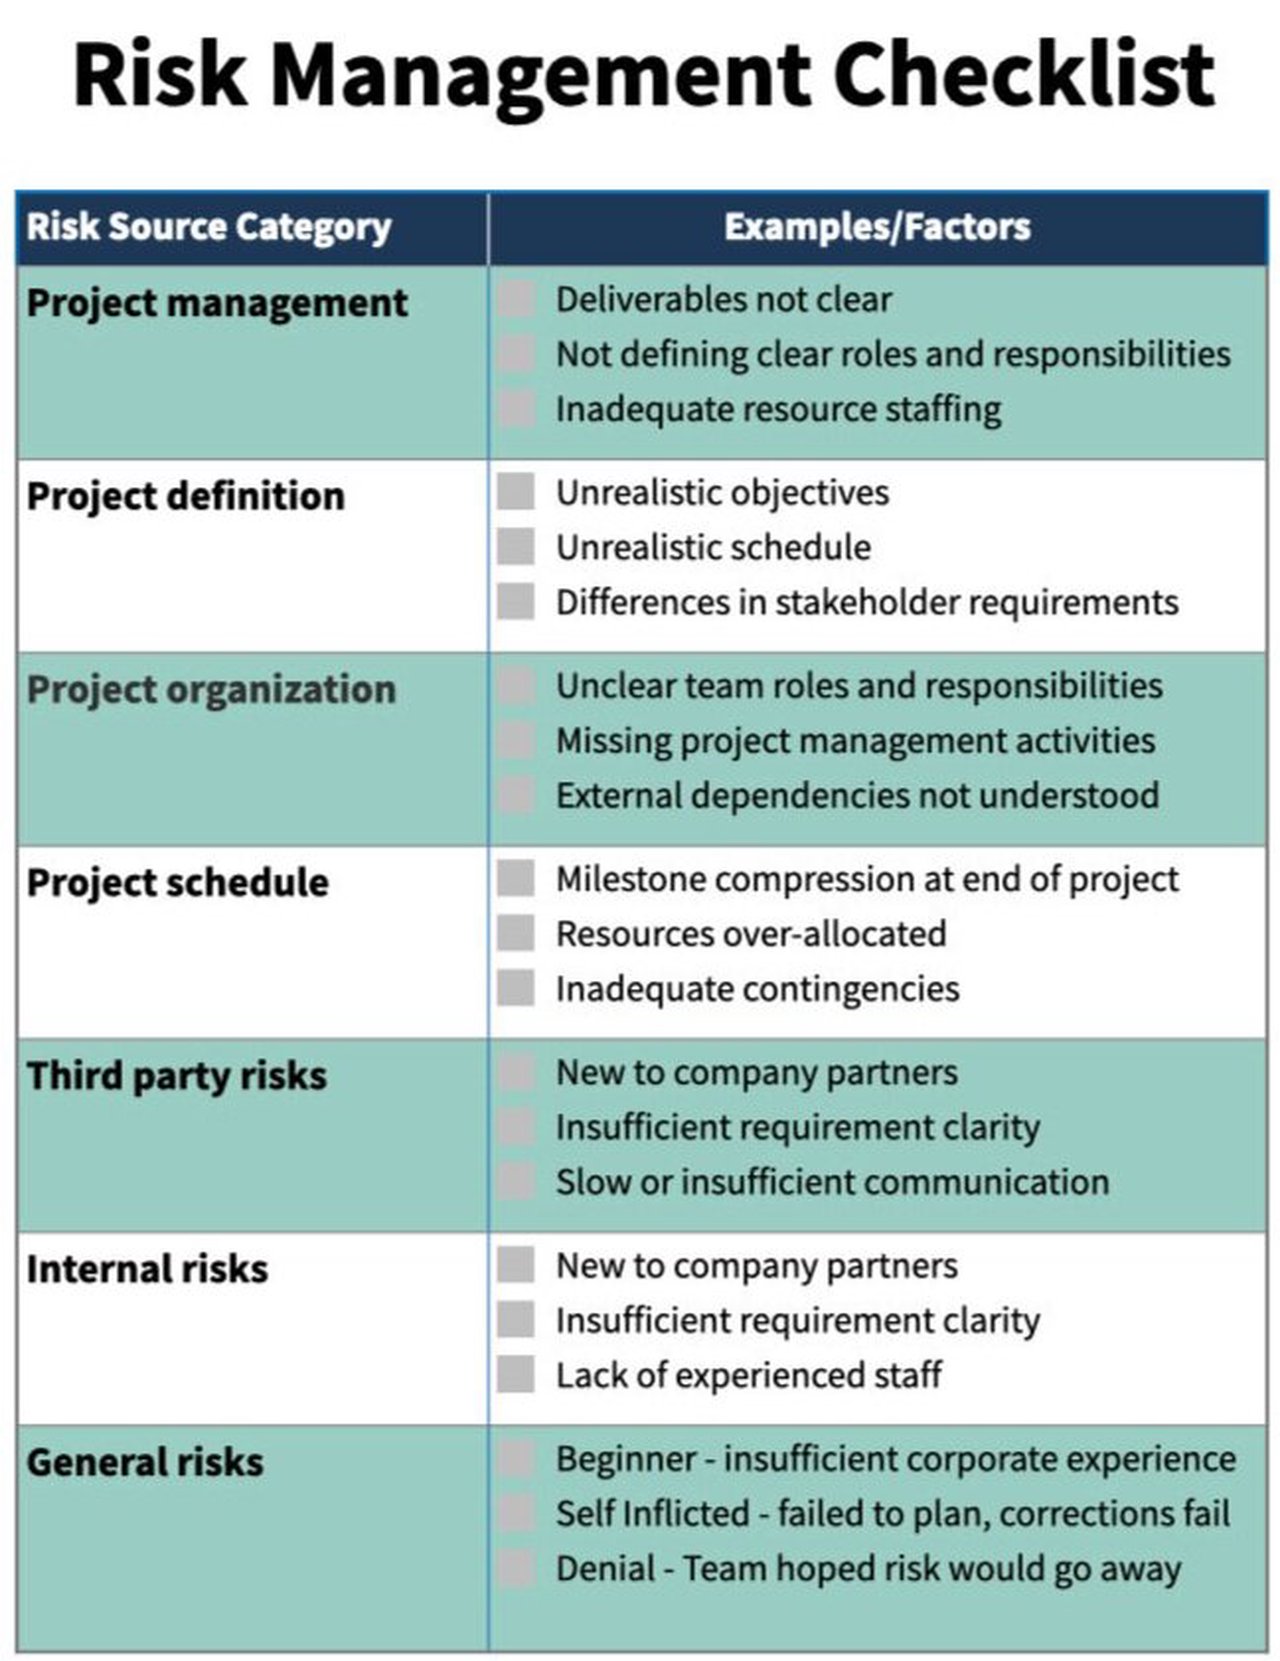
Minimize risks in three steps. Understanding risks up front, and closely monitoring them will save you time and money.
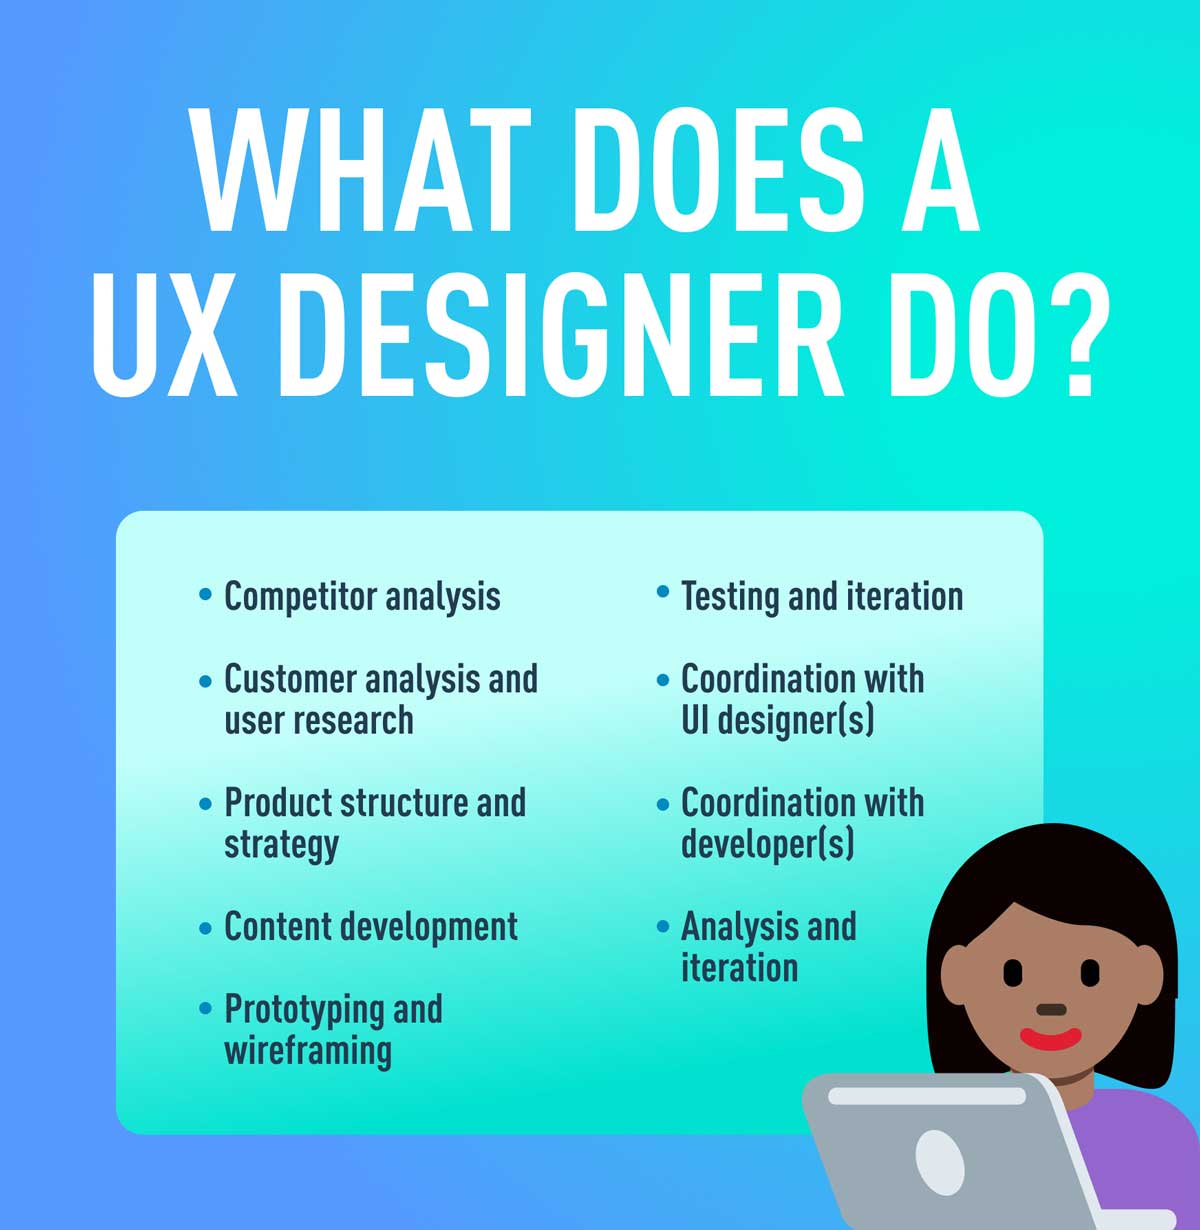
Learn how UX specialists’ skills overlap with other teams in the digital product development process.
Learn about the Agile Transformation Process to smoothly transition from a traditional organization structure and embrace agile practices
Learn what an agile project plan is, why it’s important, and how to create an in-depth agile plan for your company to streamline business operations
Discover what agile metrics are, why they’re important, and the 10 best agile metrics you need to measure your business’s success and reach your goals
Understand the agile roles that define an agile team and build effective scrum teams to streamline business operations and drive massive growth
In this article, we’ll discuss these different methodologies. We’ll define key terms like Agile product management, Scrum project management, and the Waterfall methodology and see how they compare with each other
Compare Agile VS Design Thinking; how to apply them, and why it may be better to combine the two rather than choose one over the other
Learn what refactoring in Agile is, its benefits, principles, and techniques to follow in order to utilize Agile best for software development.
Unleash the power of Agile with our handpicked selection of 14 must-read books. Enhance your project management skills, master Scrum methodologies, and transform the way you work.
Understand what an Agile workflow is, how it’s different from Waterfall, and how to create an effective Agile workflow process for your own business.
Confused between Agile and Scrum? Understand the difference and similarities between the two terms to know what to apply to your business.
Discover the different types of product innovation, and learn how you can manage and encourage it across your business research and development teams.
Understand Product Management OKRs, why they are important, and how to use them to streamline your organization’s process and workflow
Get a deeper understanding of Agile product management, what it is, why it’s better than traditional methods and how to implement it for your business
At the beginning of any major project or program, defining a clear escalation path and protocols for problems will greatly speed the project.
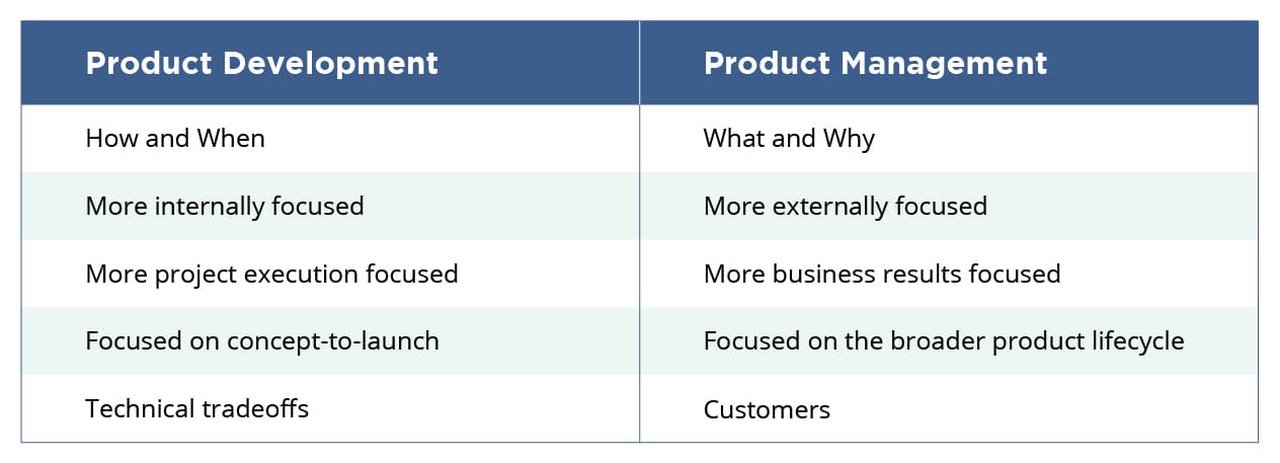
Learn more about the differences between product management and product development in our ultimate guide.
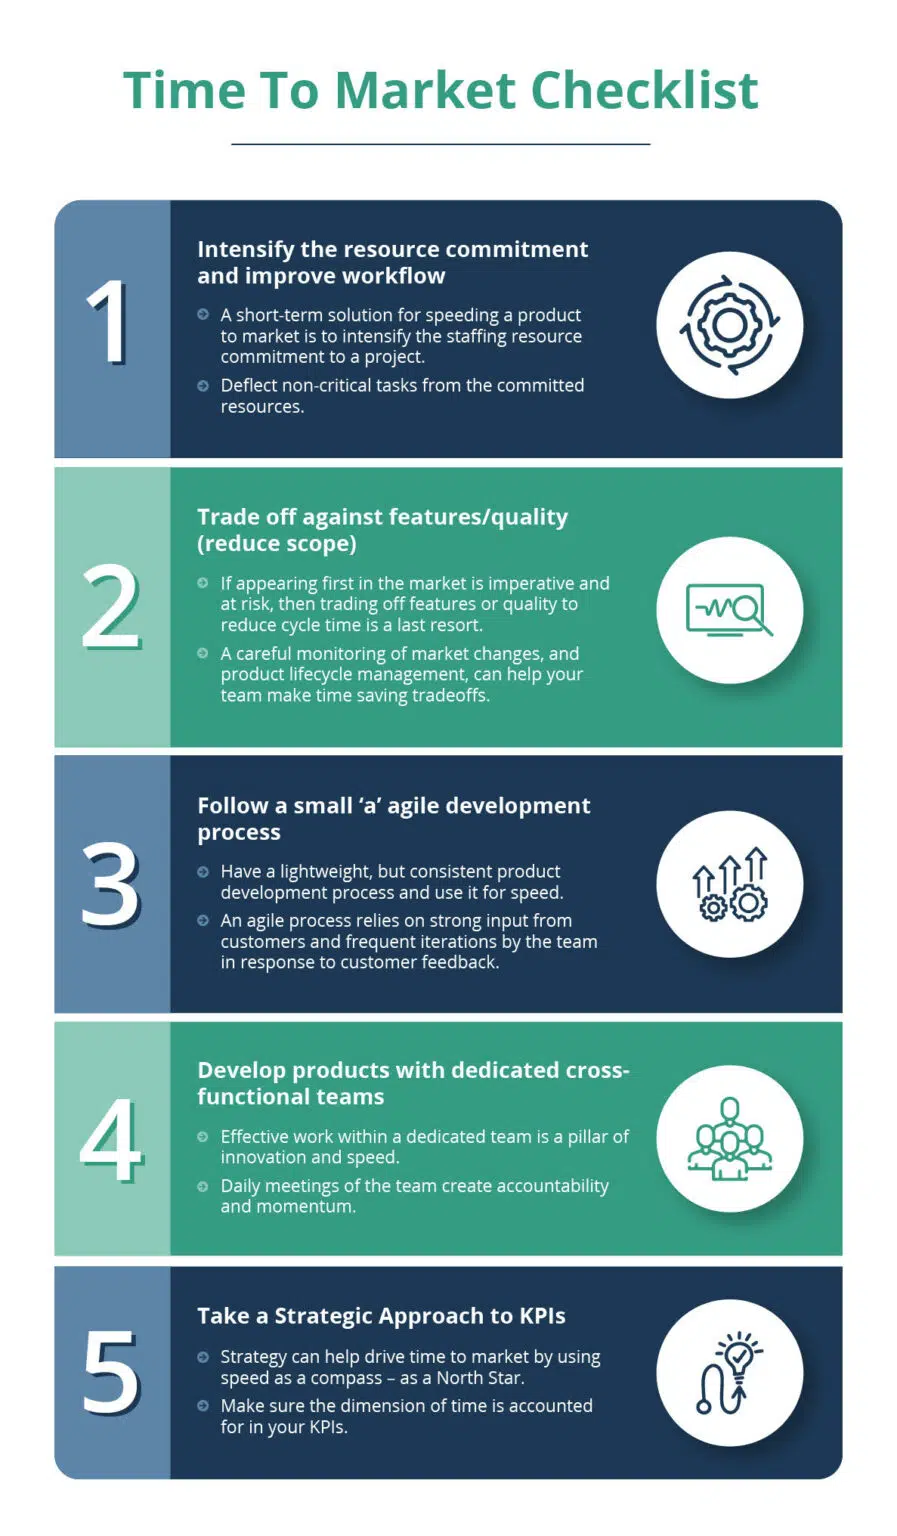
Time to market (TTM) is the length of time to develop a product from conception until it is released to the market and is available for sale.
Learn everything you need to know about creating a product management roadmap, why it is important, and choosing the software that’s best for you.
Discover the 10 best product management podcasts in 2023 to stay updated on the latest news, trends, and insights.

Dive into the world of Data Product Management with TCGen. Explore its significance in today’s digital landscape, the roles of data product managers, and how it differs from traditional product management to drive business success.
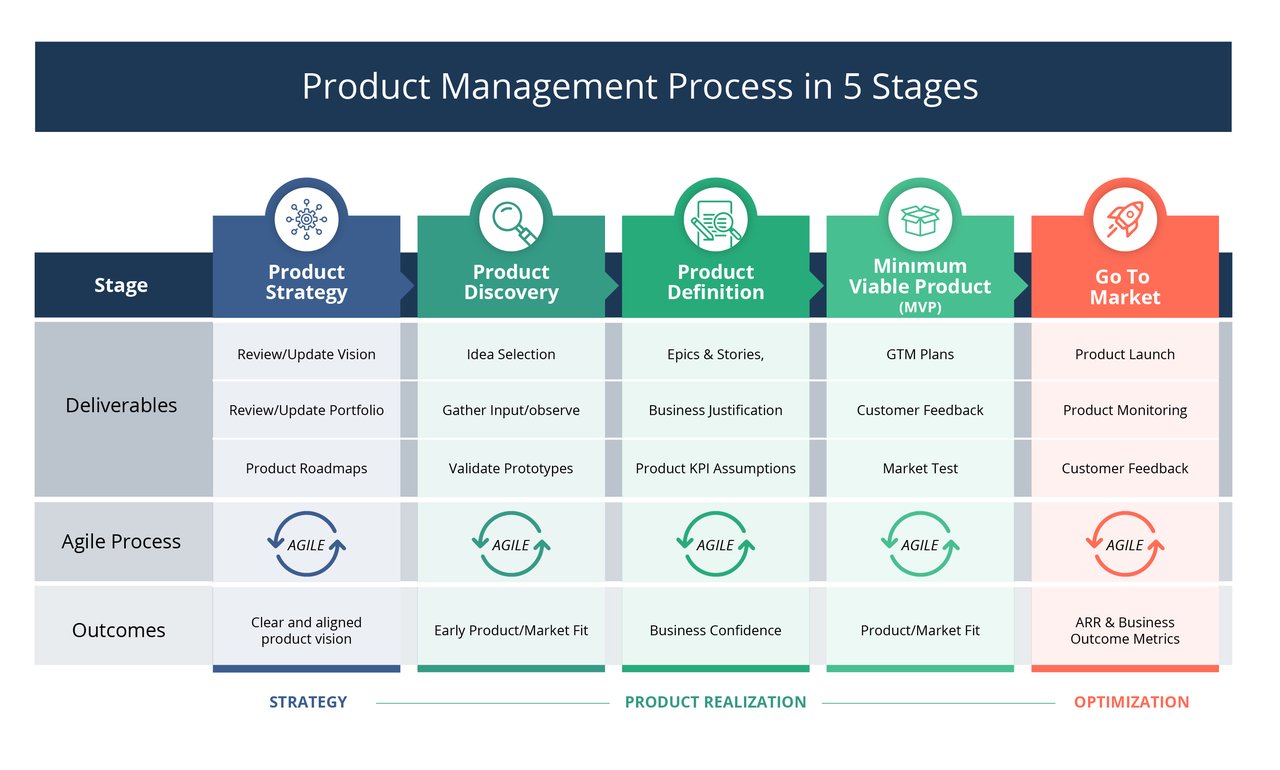
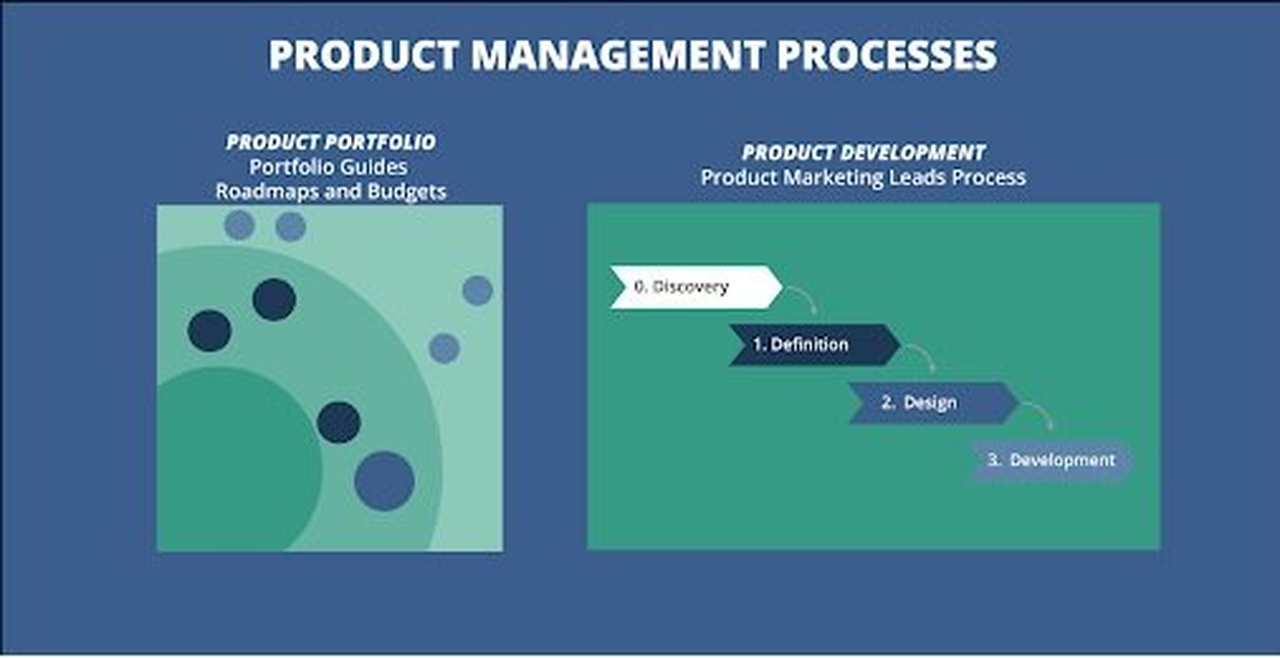
Learn more about the product management process, its main stages, differentiation in terms of software and hardware, examples and much more in our guide.
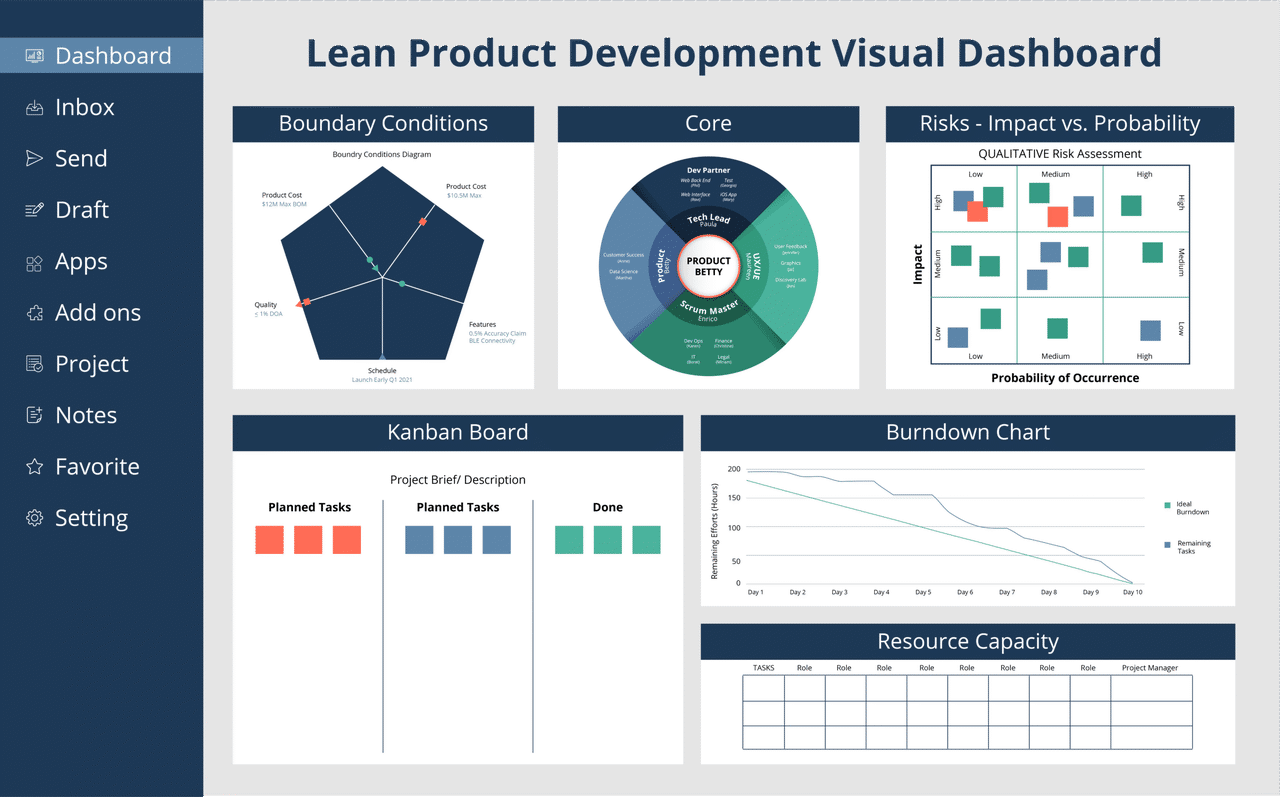
Learn more about lean product development, its benefits, implementation, and tips for success in our guide.
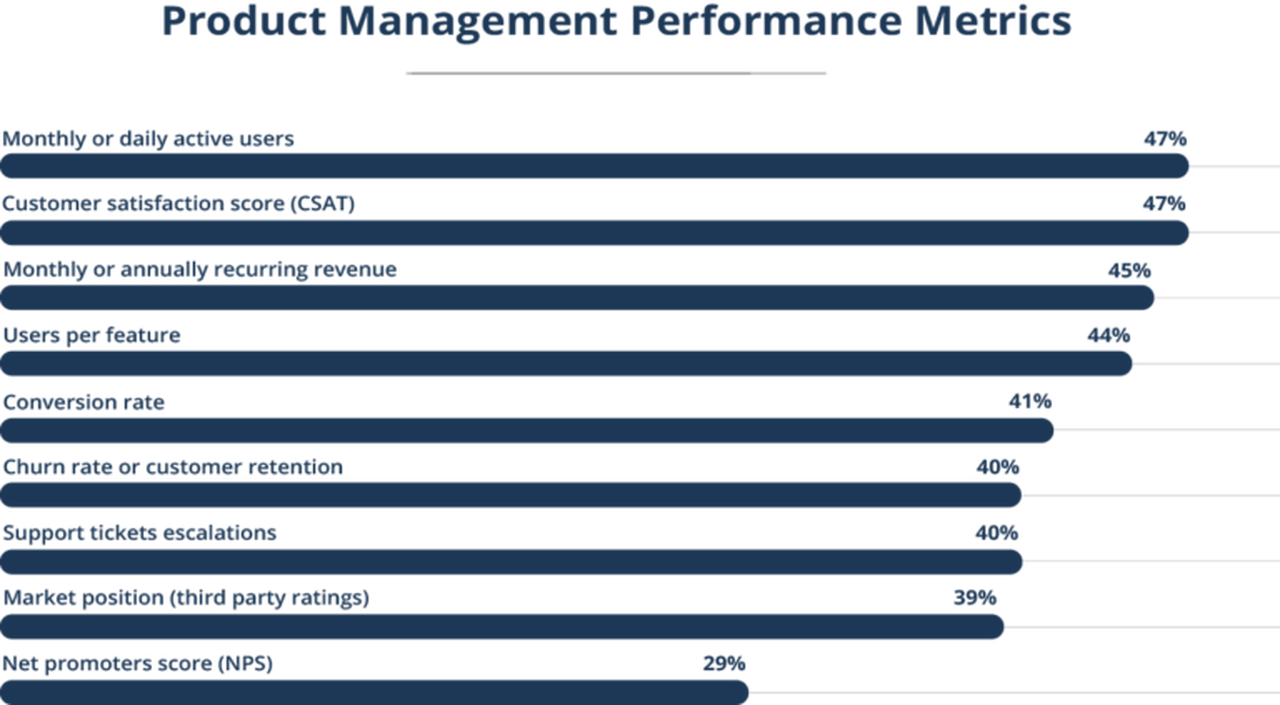
Learn everything related to product management performance metrics in our ultimate guide put together by our team of experts on the field.
Do you want to know more about the difference between product owners and managers? Learn more in our product owner vs product manager guide prepared by our team
Learn what the Spotify Model is, how it works, and the benefits/challenges you may face when applying it to your own business.

Using product management frameworks is a way to dramatically improve product management and make your products a success. Read on to find the most powerful frameworks you could use to boost your business.
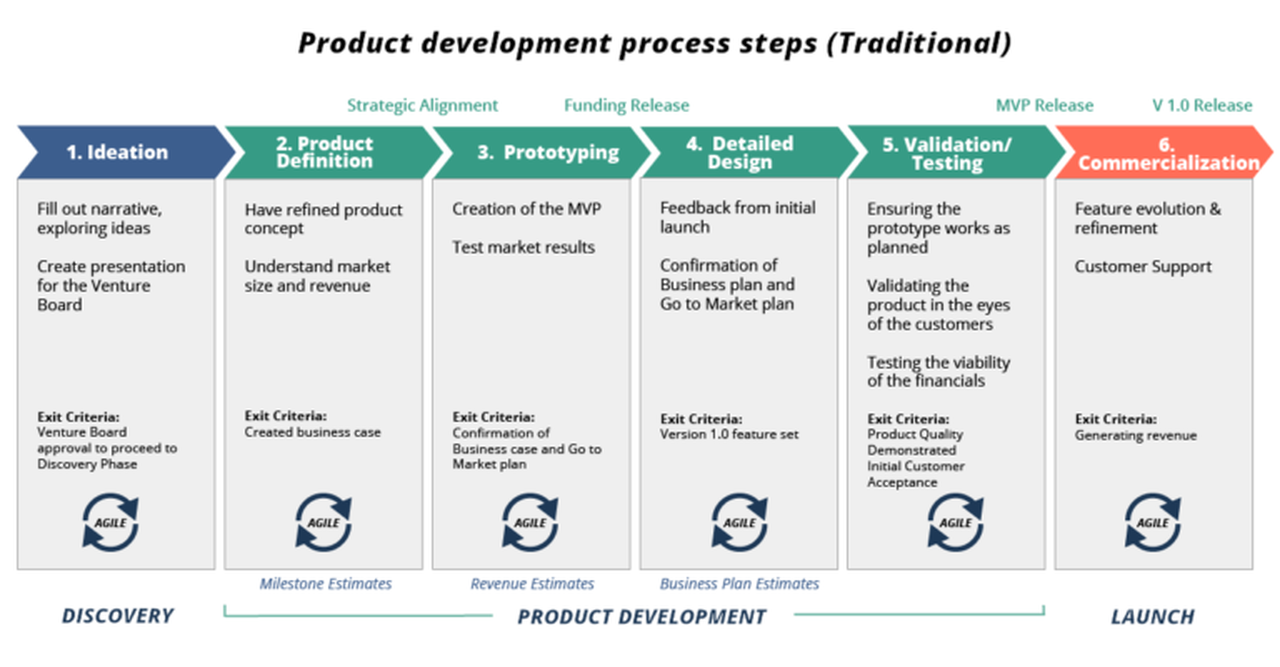
Product management is a complex process that begins with ideation and ends in commercialization of a new product.
New product development is the ideation, design, production, pricing, and launching of new products to your target customers to provide a solution that addresses an important need.
Boost innovation with TCGen’s Product Development Metrics Consulting. Enhance leadership, make superior decisions, and drive remarkable growth today!
These Product Development Metrics Tools are based on real life examples, and have been tested in the field with clients on multiple engagements. We often are stuck when first getting started working on a complex issue, because we don’t know how to take the first step.
These Product Development Process Tools are based on real life examples, and have been tested in the field with clients on multiple engagements. We often are stuck when first getting started working on a complex issue, because we don’t know how to take the first step.
The new product development process describes the steps to move from an idea to a finished product to generate a profit.
The fastest way to destroy an Agile implementation is to let functional silos get in the way. Unfortunately, it happens all the time. And it happens because many companies underestimate the organizational implications of a successful Agile implementation.
The rate of technology and market change today is staggering. Yet, too many companies lack a Portfolio Management process that enables them to respond effectively to such shifts in markets and in the labs.
In too many companies, the front end of development remains fuzzy. The same companies that will micro-manage IT, or spend time simplifying a portion of their manufacturing operations, show little interest in improving the early stage innovation activities that drive future growth.
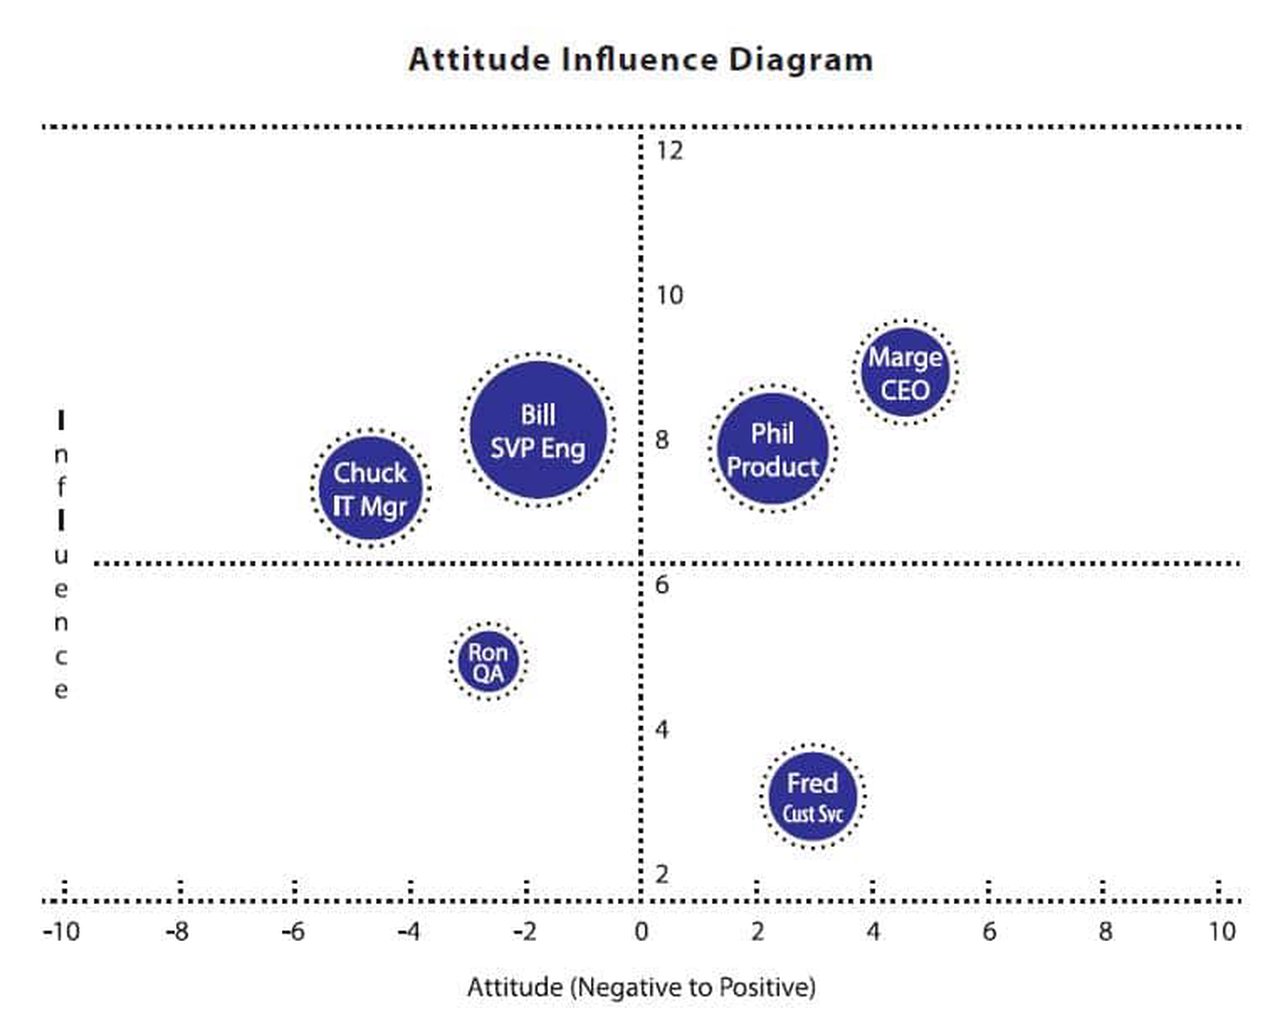
Have you ever had an excellent product concept derailed by internal politics? It is frustrating since good ideas that could benefit the company as well as the individuals involved are blocked for irrational causes. The Attitude Influence Diagram is one tool that helps to overcome political obstacles.
Creating high-performance teams is a competitive advantage. Through high performance teams it is possible to quickly innovate and deliver winning products to market.
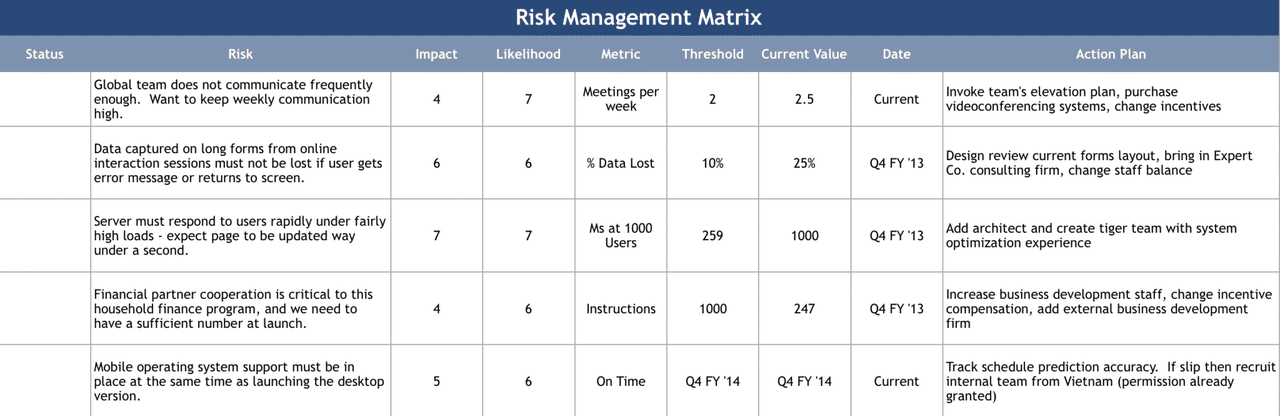
You can’t take the risk out of invention and no project is completely risk-free. But you can reduce the risk, even in the most innovative programs. How? By anticipating it. The Risk Management Matrix is an elegant way to anticipate, manage, and mitigate product development risks.
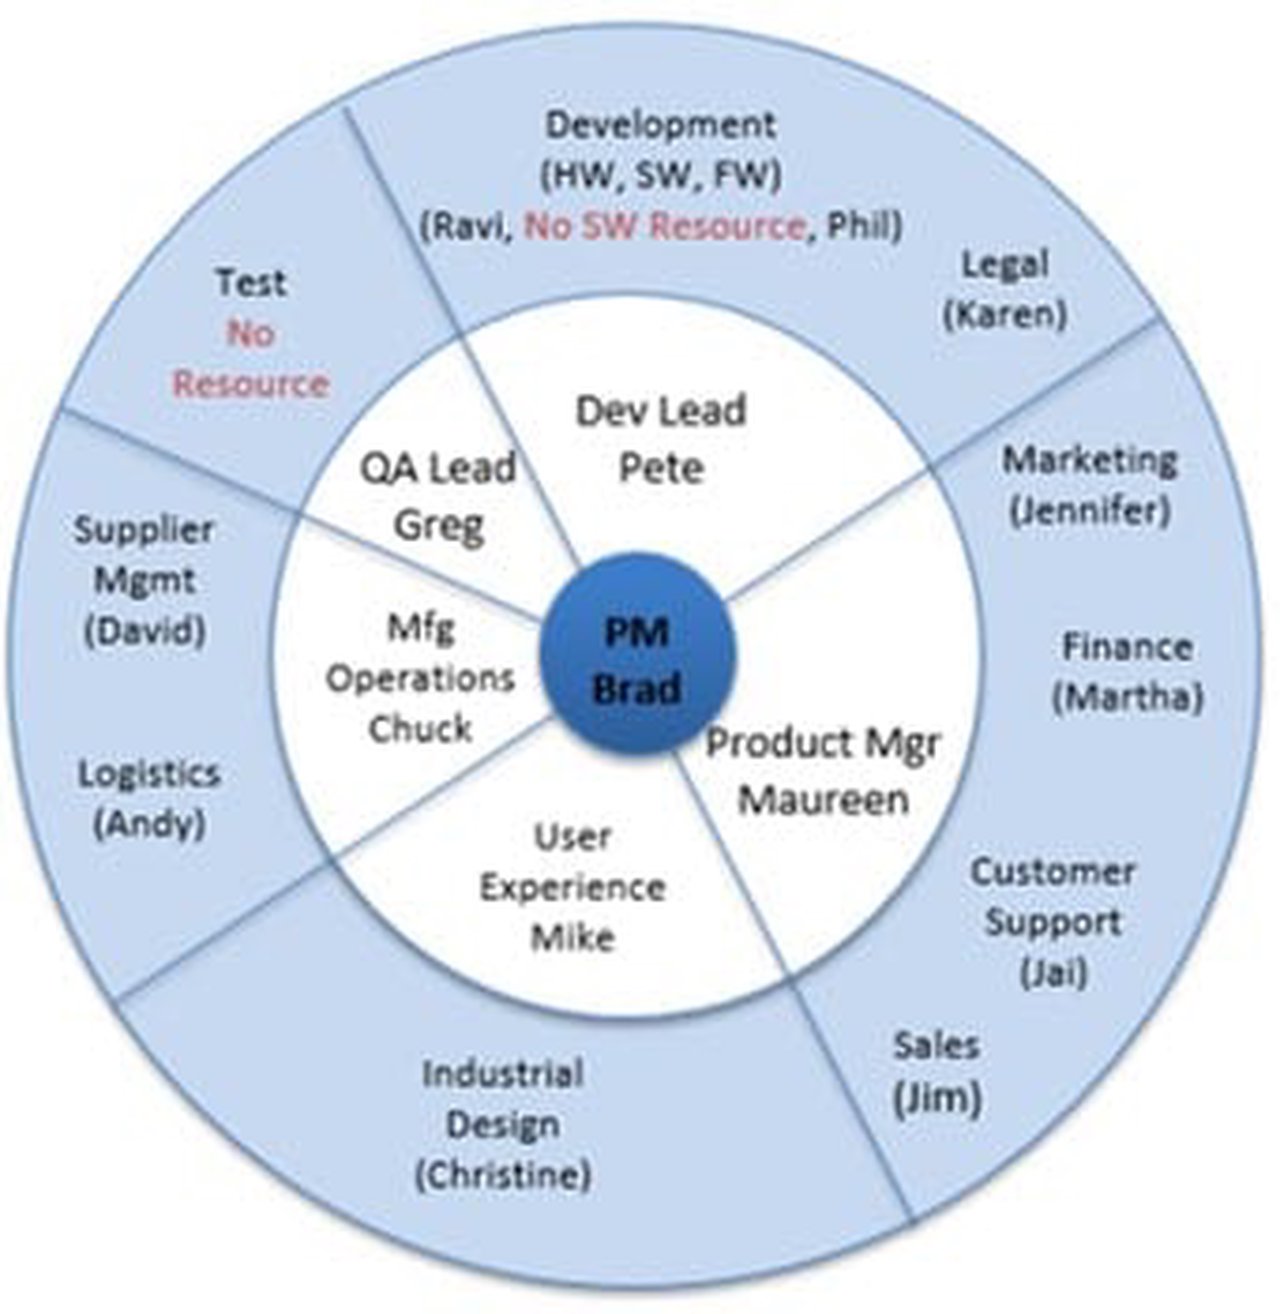
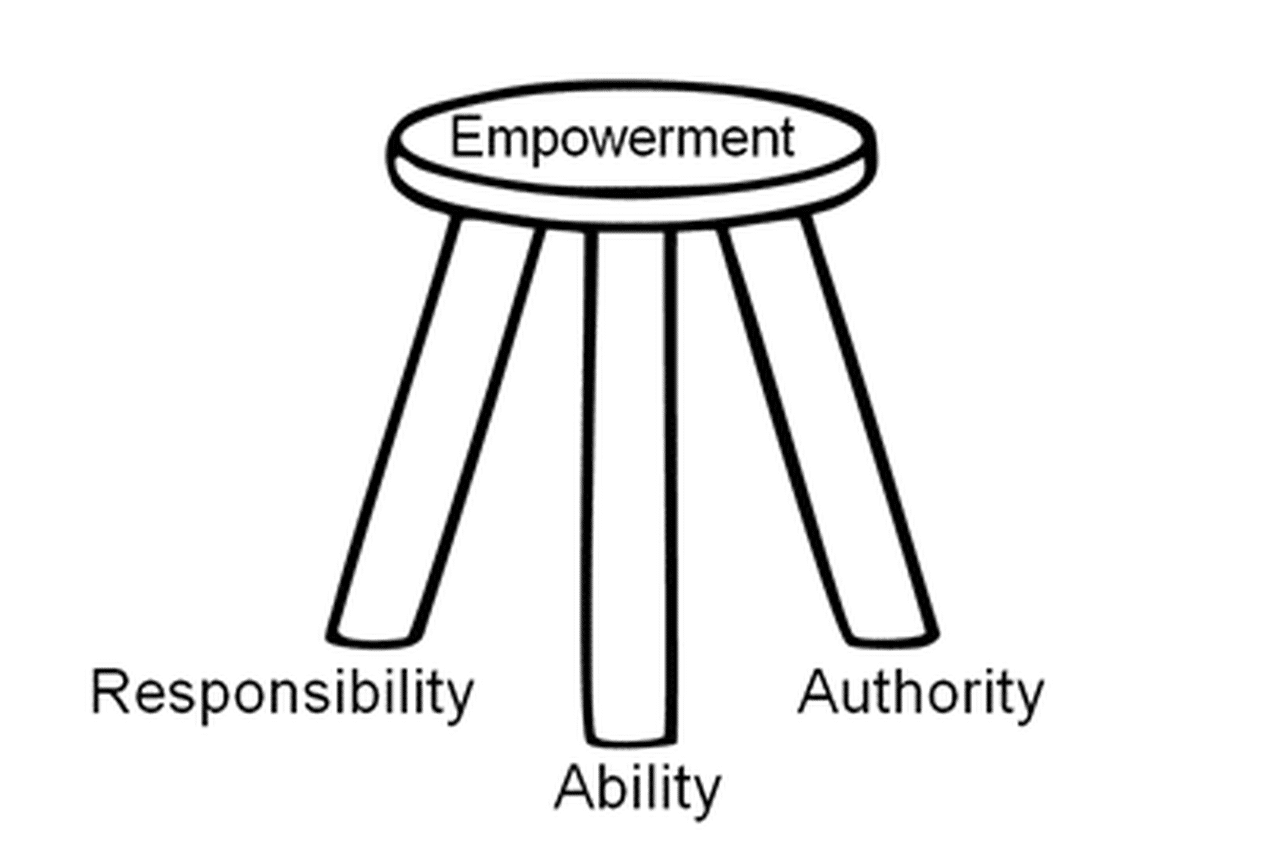
Inadequate staffing or unclear priorities can leave resource gaps that derail projects. Team Wheel helps identify resource gaps.
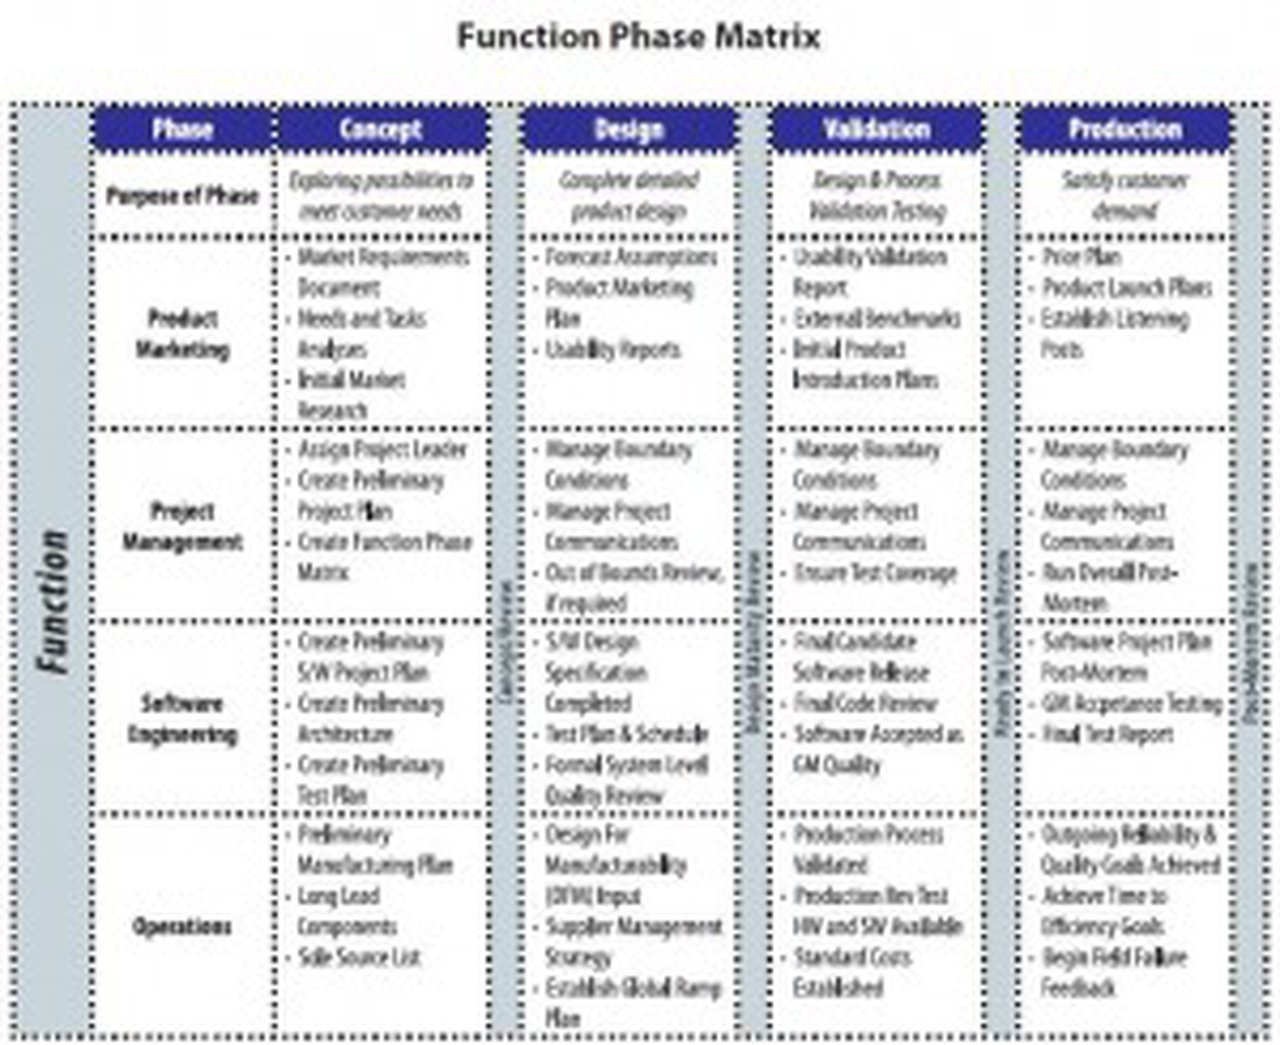
The Function Phase Matrix helps clarify cross-functional team objectives, roles and responsibilities. It tracks key deliverables across the phases of a project and identifies each function’s participation in each of these phases.
Get to know about the simple auto responses that you can use in your recruiting process to improve your reputation and brand.
So-called “Waterfall” or “Phase-Gate” product development methodologies often give management the illusion that they are under control of the project, while they are actually just meddling and slowing it down.

Keeping a group of people of different cultures and different time-zones coordinated and productive can be a monumental task. Here are seven tips that may help.
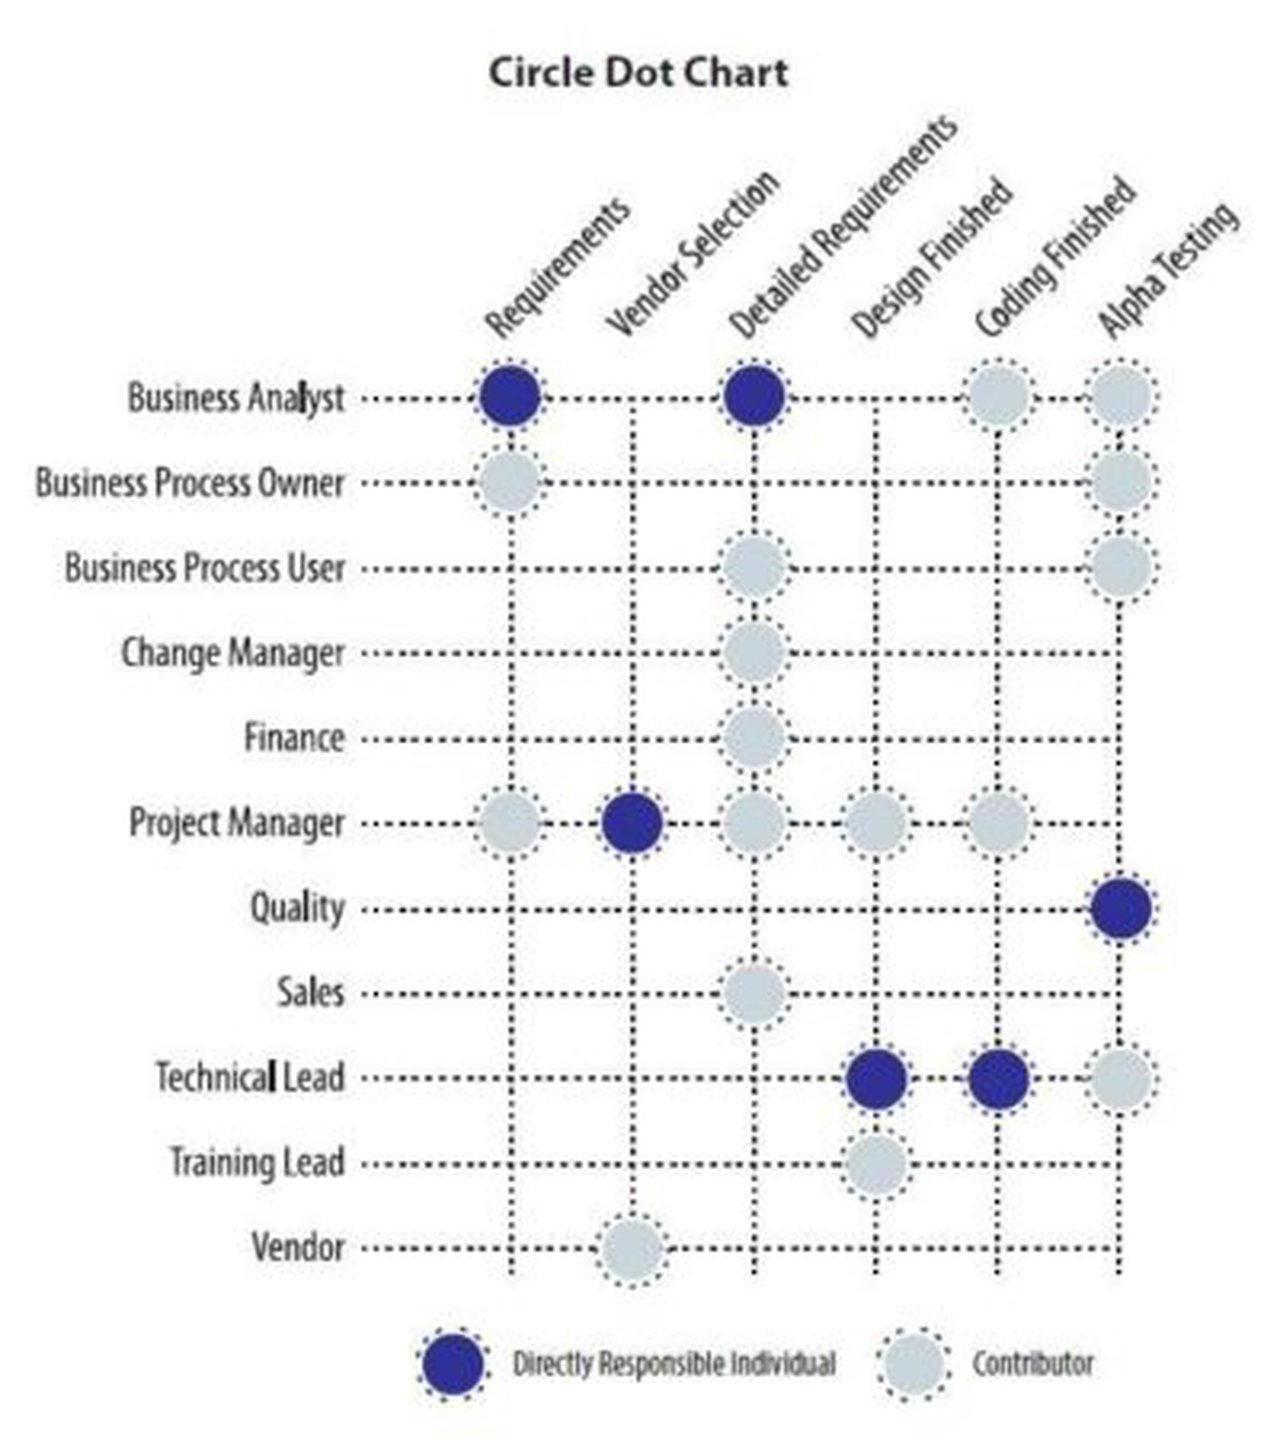
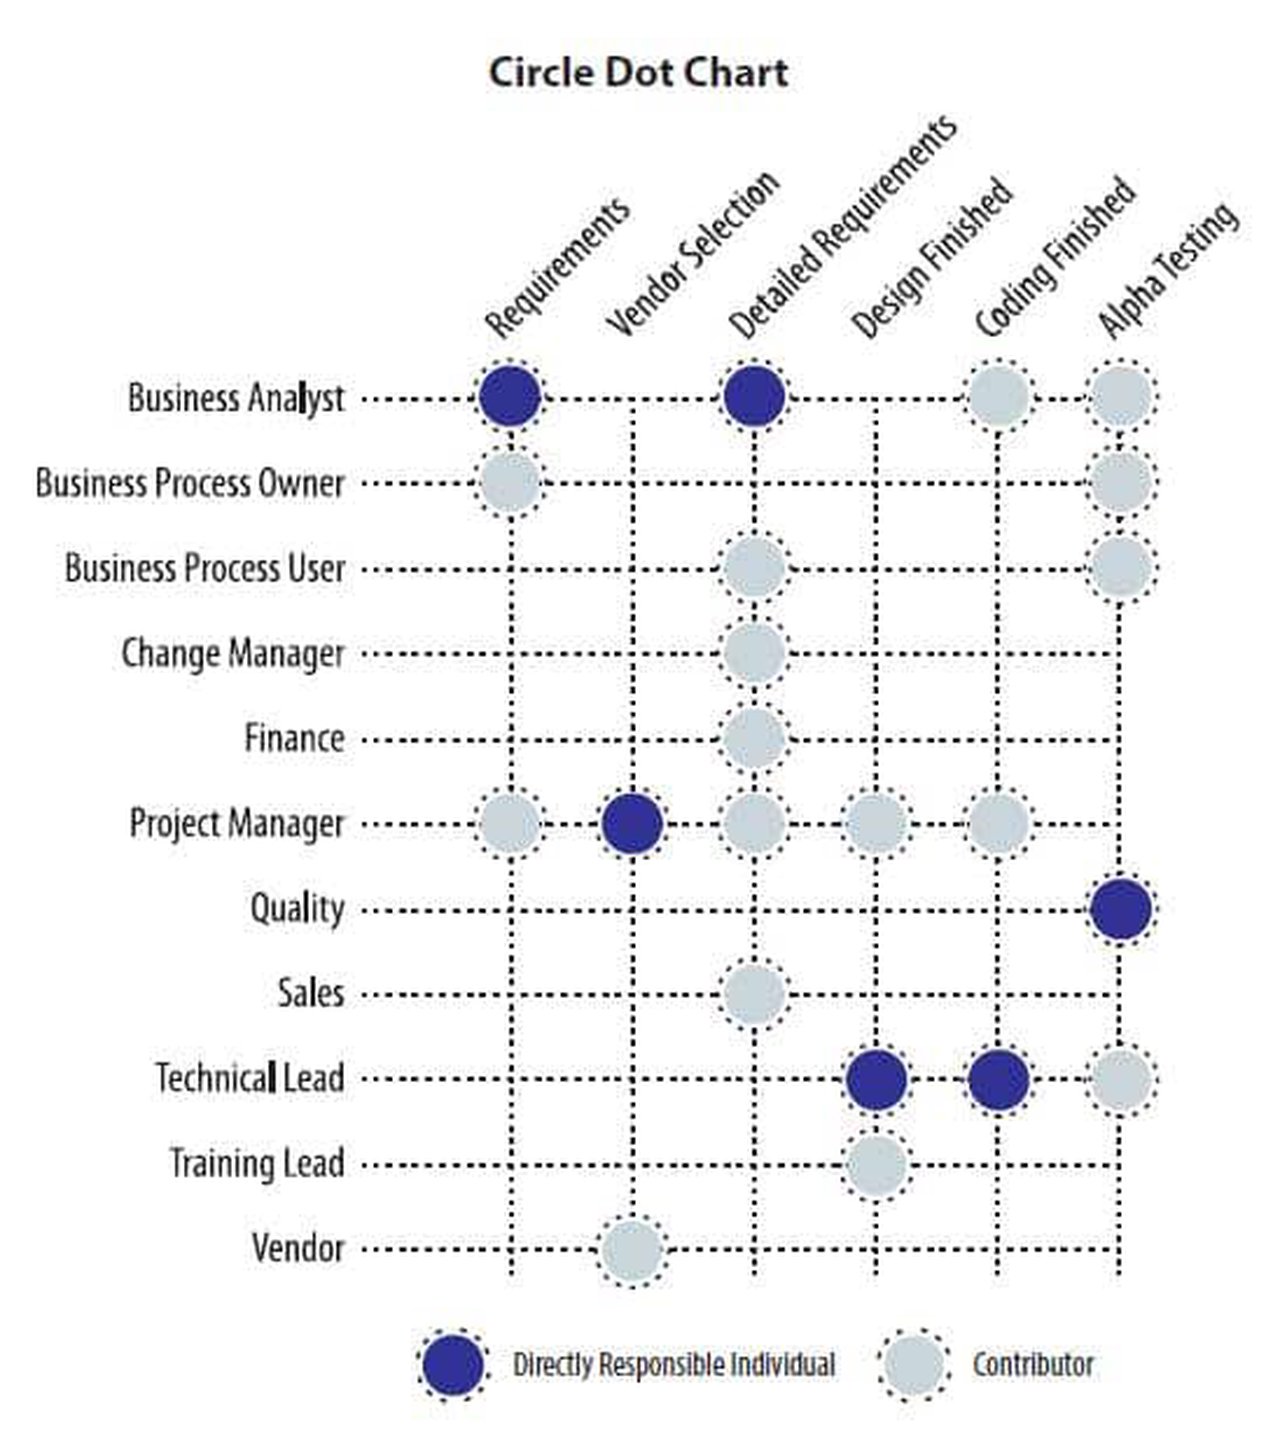
Sorting out who does what on a project is pretty basic. Clear tasks with clear responsibilities and deadlines is Project Management 101. But how many projects have you managed where it was unclear who was responsible for a deliverable until it turned into a mess? The Circle Dot Chart addresses this issue.
Project post mortems can be an excellent tool for learning from mistakes and implementing process and decision-making improvements.
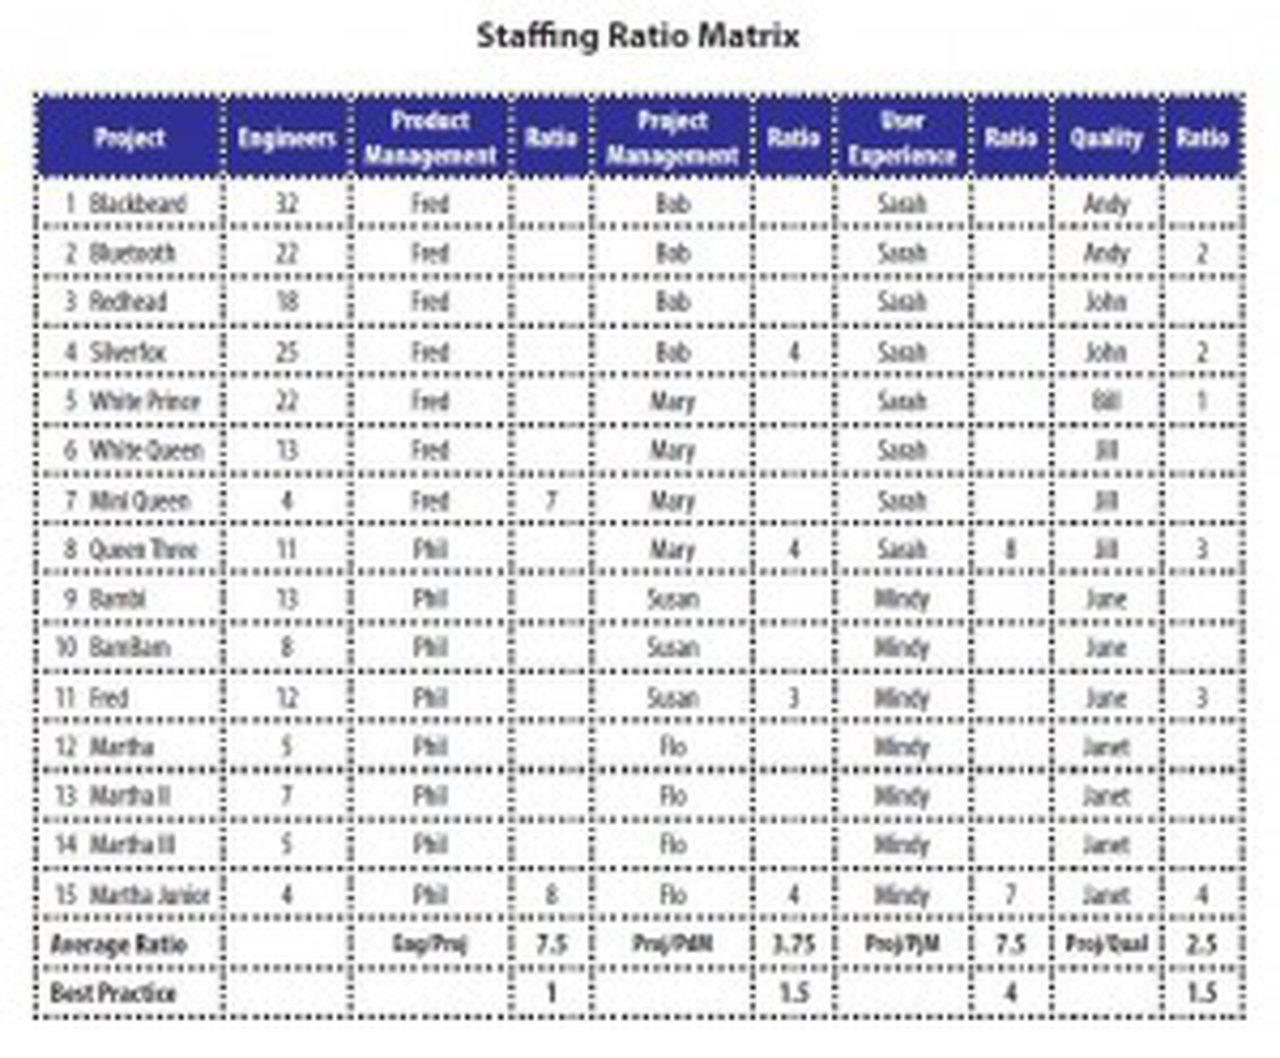
The Staffing Ratio Matrix contains a summary of all the projects in a given function, charted against the key functions found on a cross-functional team.
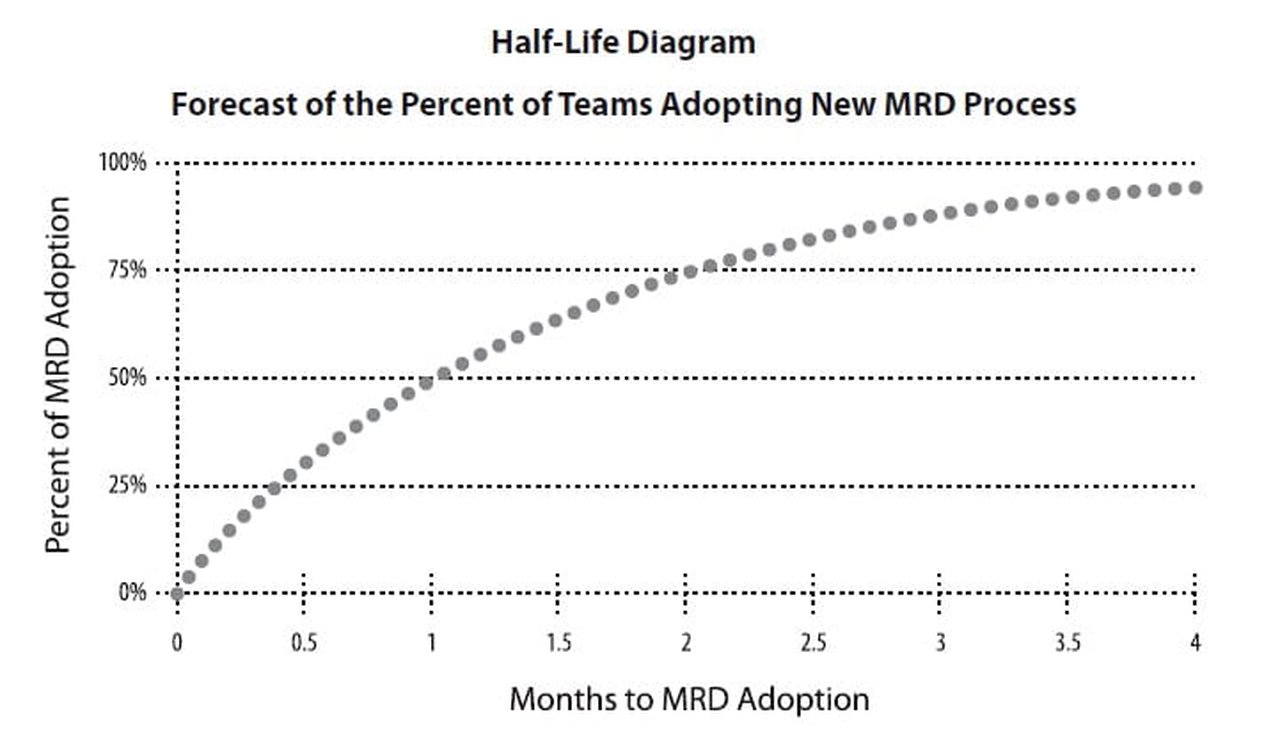
The Improvement Forecaster consists of an equation, and a graphical plot of expected improvement over time. It uses estimated degrees of technical and organizational complexity, and based on prior programs, estimates a rate of improvement.
Pitch points for Teams that develop new products and are challenged to produce a high-quality, valuable solutions in as short a time as possible and within budget.

Agile methods can be implemented for hardware product development. Increase speed and predictability by employing agile for hardware development projects.
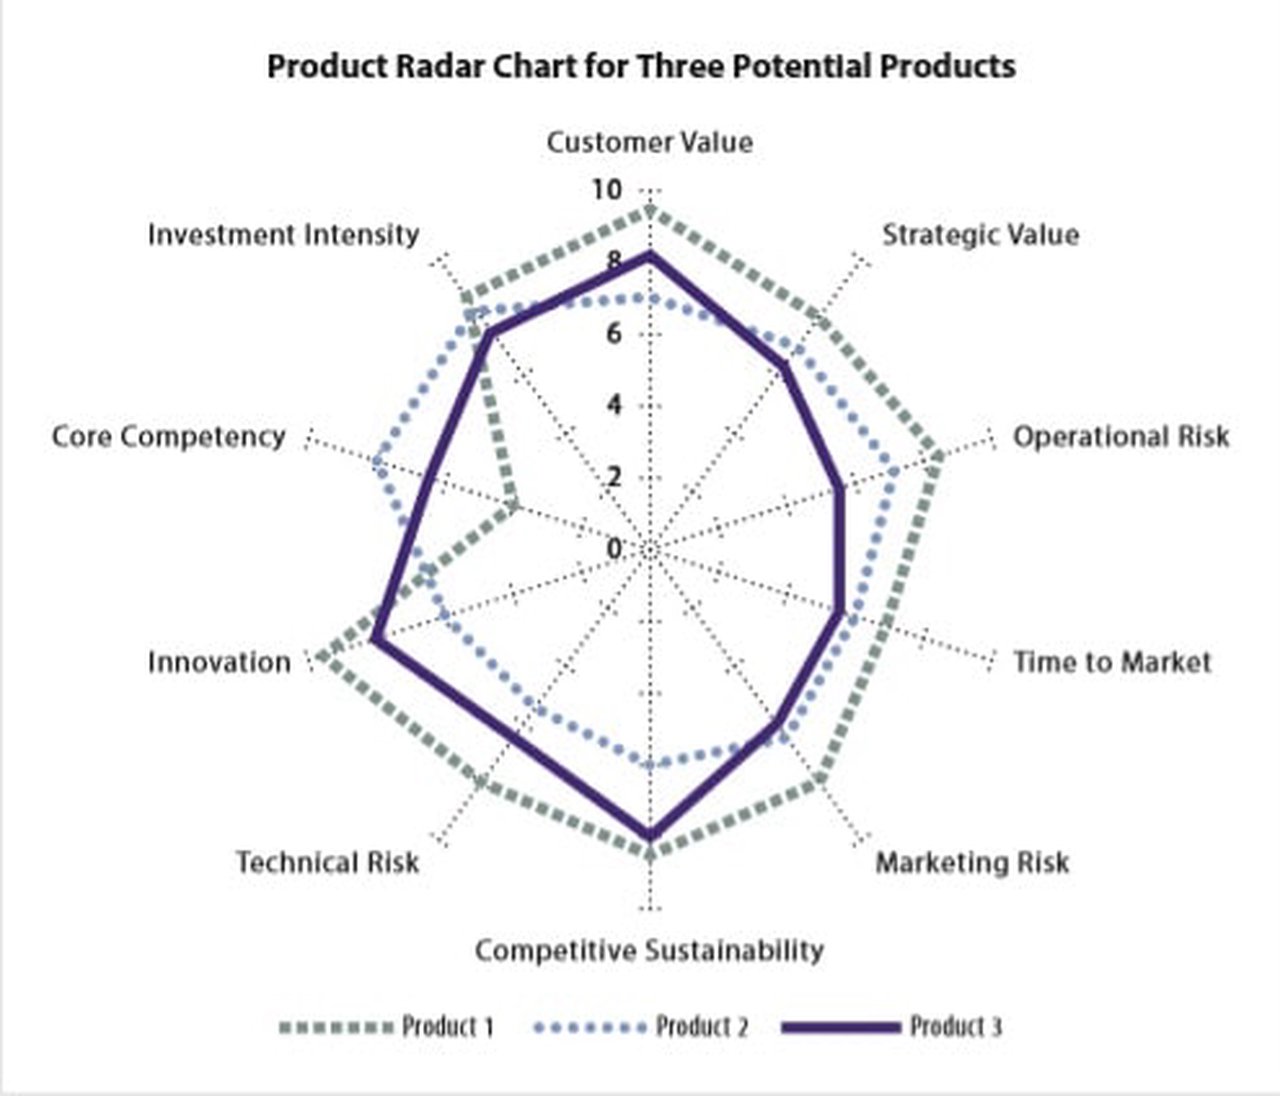
The Product Radar Chart offers a way to evaluate and communicate the myriad factors that go into product and portfolio decisions by graphing the key dimensions of a product or concept and comparing them to alternatives.
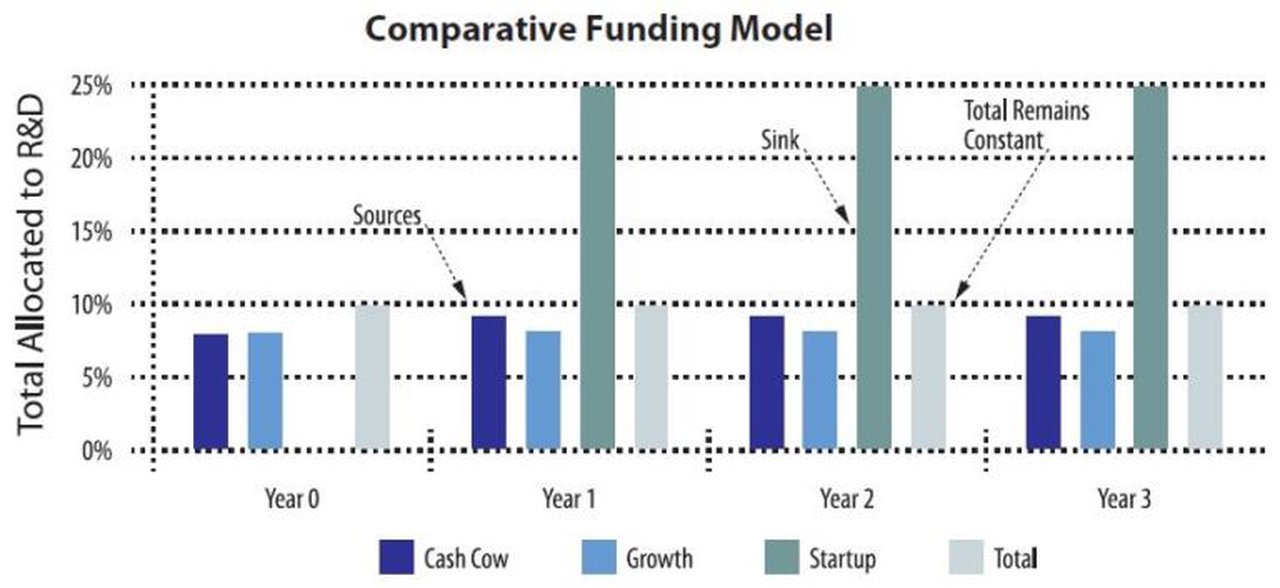
Most businesses today are looking to take advantage of innovation to drive revenue growth, but they lack methods to fund the R&D expense necessary to support expansion. Use this handy visualization tool to fund innovation programs.

A Platform Derivative Chart is a diagram that depicts a set of related products over time. This is the most powerful type of Product Roadmap that highlights relationships between derivatives.
The best way to estimate the probability of success is a combination of internal factors and an understanding of the competitive structure of the market environment. Triangulation provides the most reliable guidance with the least effort.
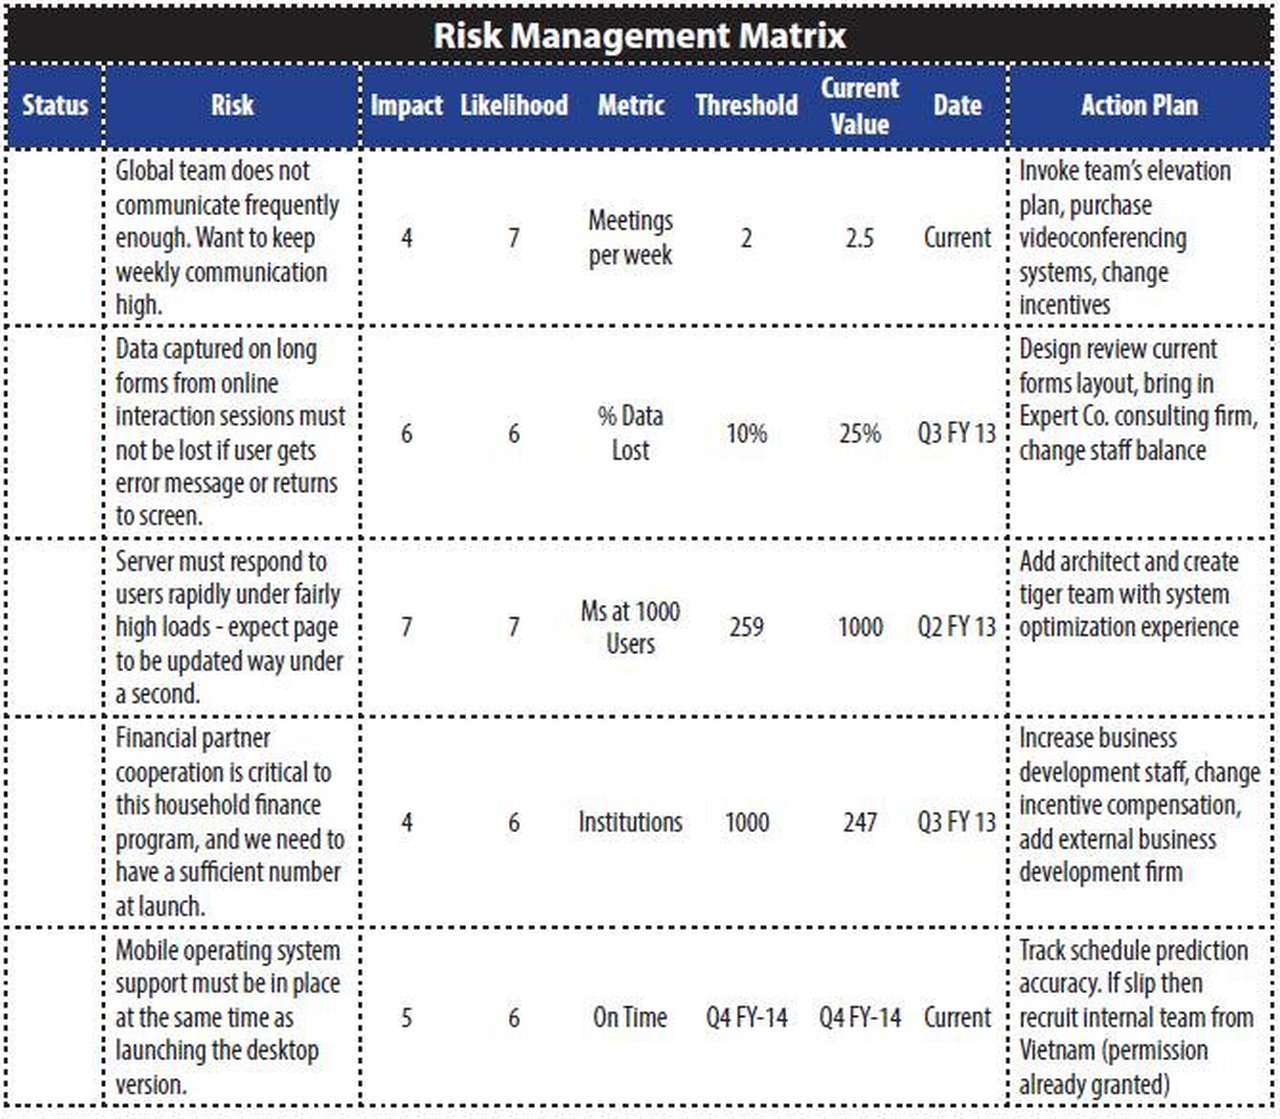
Innovation entails many kinds of risk: technical, market, or risks related to external events. Product developers can’t avoid it, but they can do more to mitigate risks.
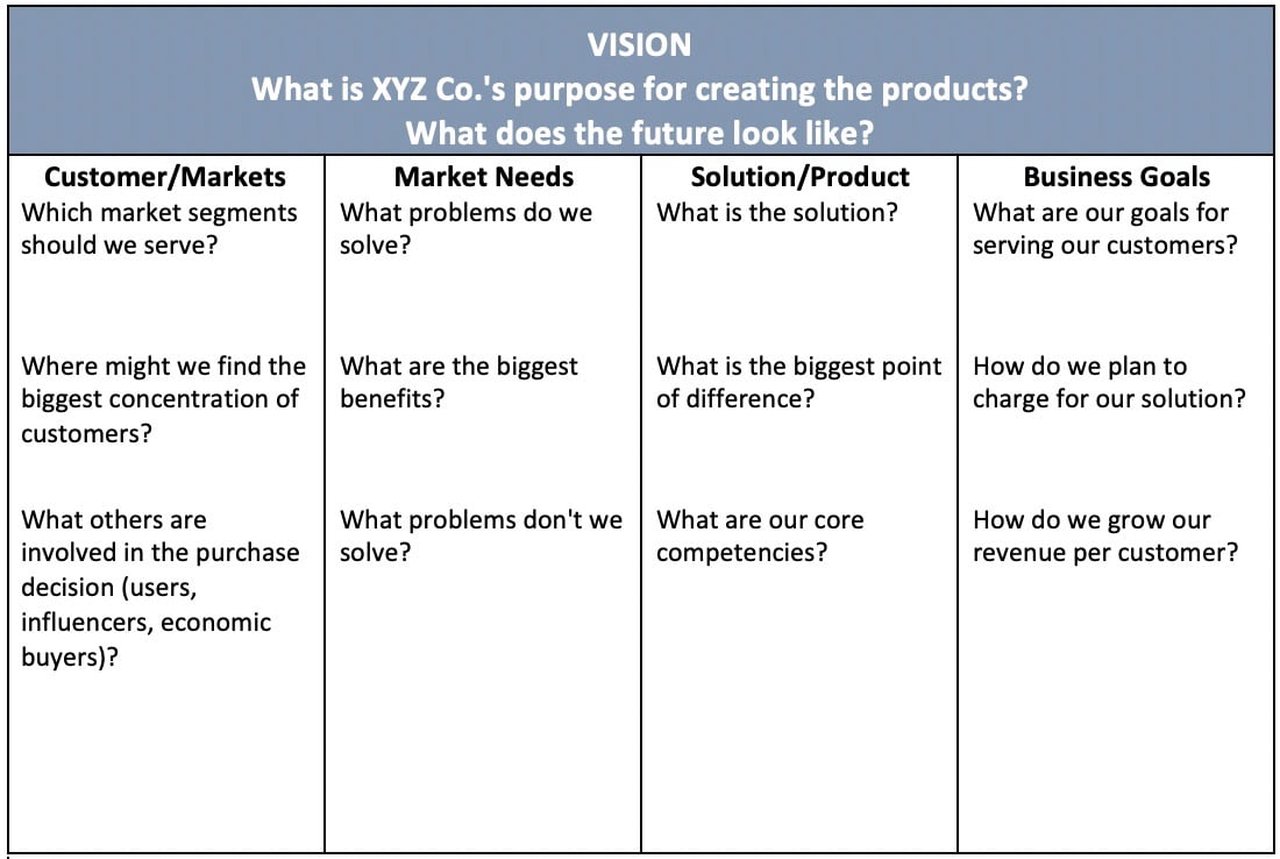
Have you ever wondered how to create a great product vision? Let’s show you. Start with some examples to get your reference frame properly set. Then look at some of the formats that might work best for you.

Four times Apple tried and failed to adopt a consistent product development process. We established a target metric with the aim of seeding the changes within the organization so that they took root.

Product Development lessons learned from developing BOSE’s blockbusters products - BOSE’s Noise-Cancelling Headphones and the BOSE® Wave® Music System.
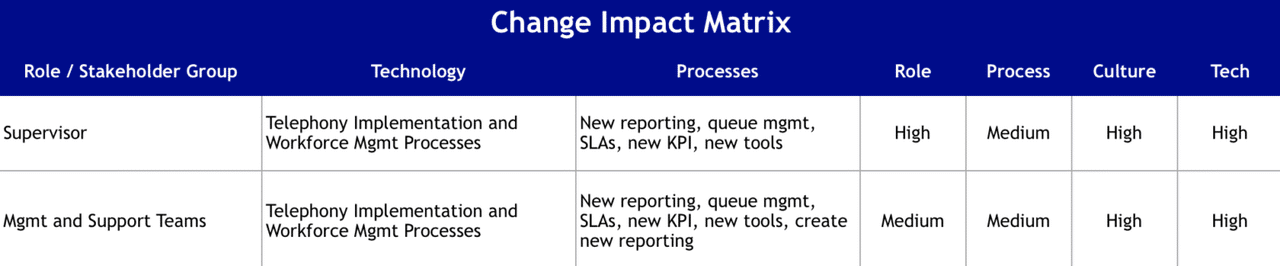
The Change Impact Matrix is a descriptive tool that details the scope of the changes that everyone involved in a project will face. The matrix is useful for presenting the project context to upper management when discussing the project status, schedule, and progress to plan.
We’ve all experienced those mind-numbing meetings – there are a lot of people in the room, and many issues to resolve – but at the end of the meeting, little has been accomplished – what a waste of time and energy! One of the biggest factors driving inefficient meetings is organizational politics.
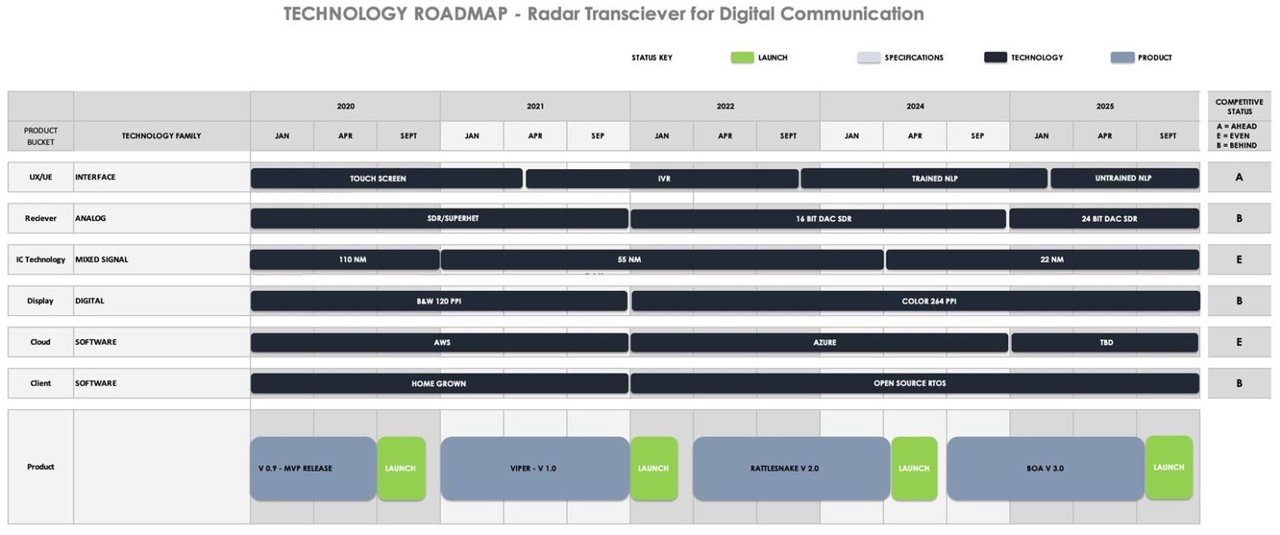
The Technology Roadmaps ties technologies & product timetables together by indicating which core technologies will be mature enough to incorporate into a particular product release.
Many of our clients are using virtual communities to communicate and collaborate with outside partners. Managed communities enable you to share ideas and present the best proposals to the leadership team. Here’s a tool that helps select the best type of community for your needs.
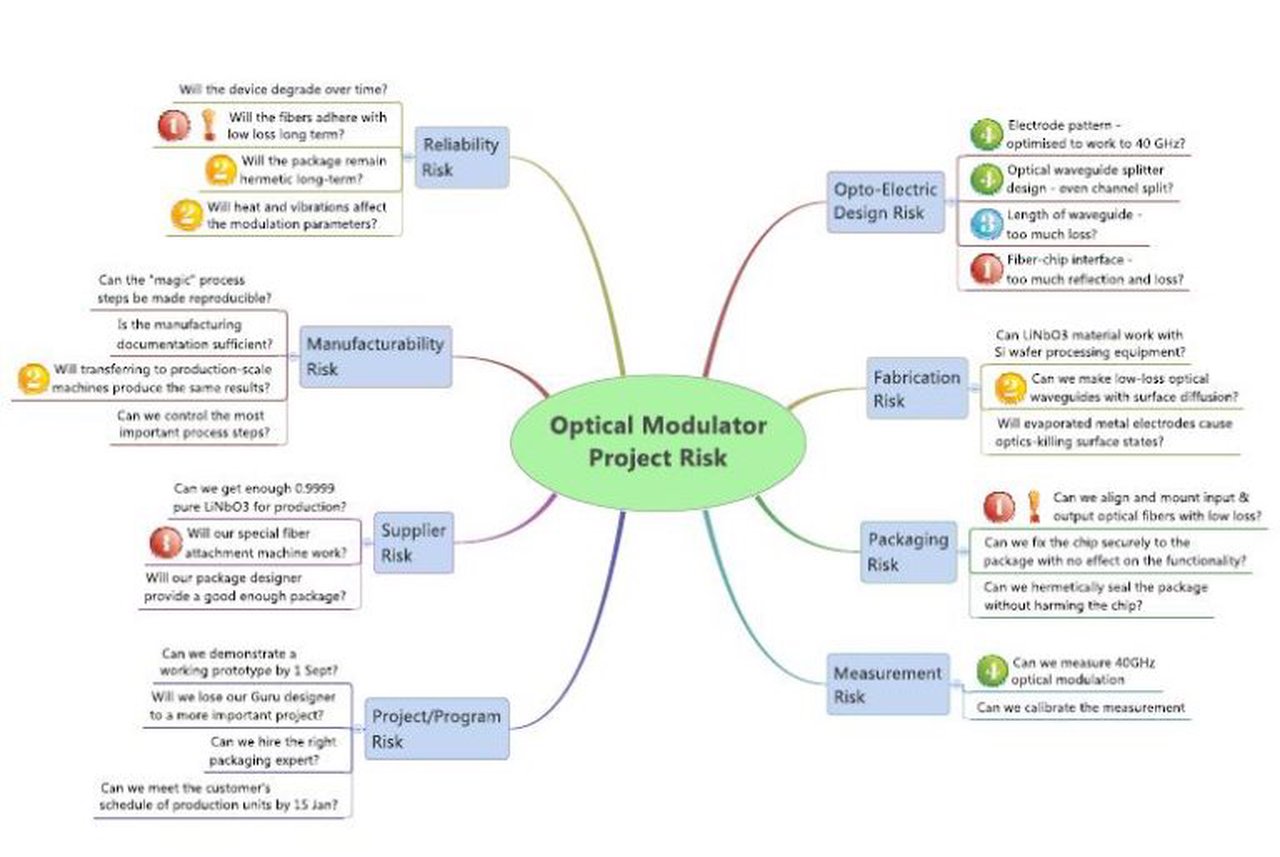
The Risk Mind Map enables a team to create a comprehensive risk profile. It allows management to anticipate where risks might arise and to prepare to meet these challenges more effectively.
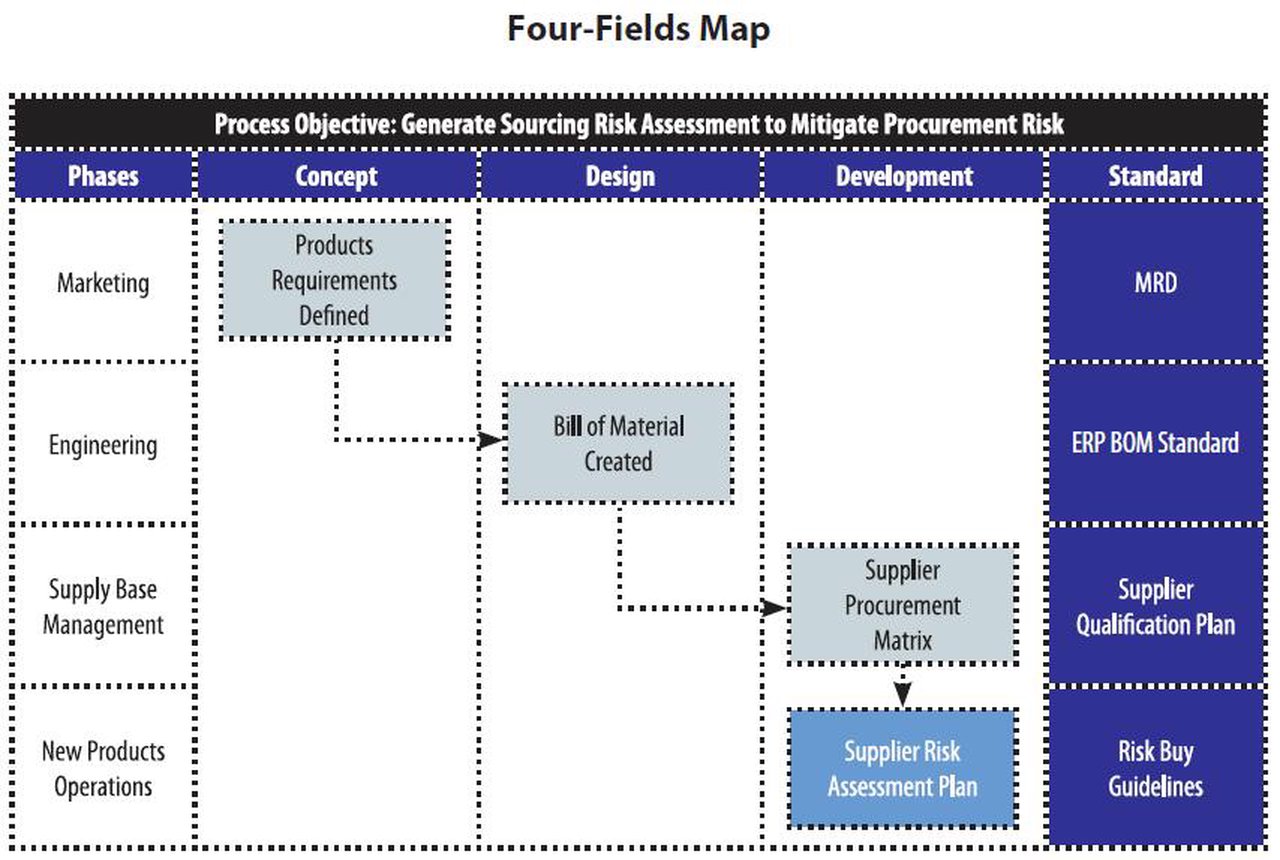
Four-Fields Process Map Originated in Japan, the Four-Fields Map is a graphical technique most commonly applied to cross-functional processes.

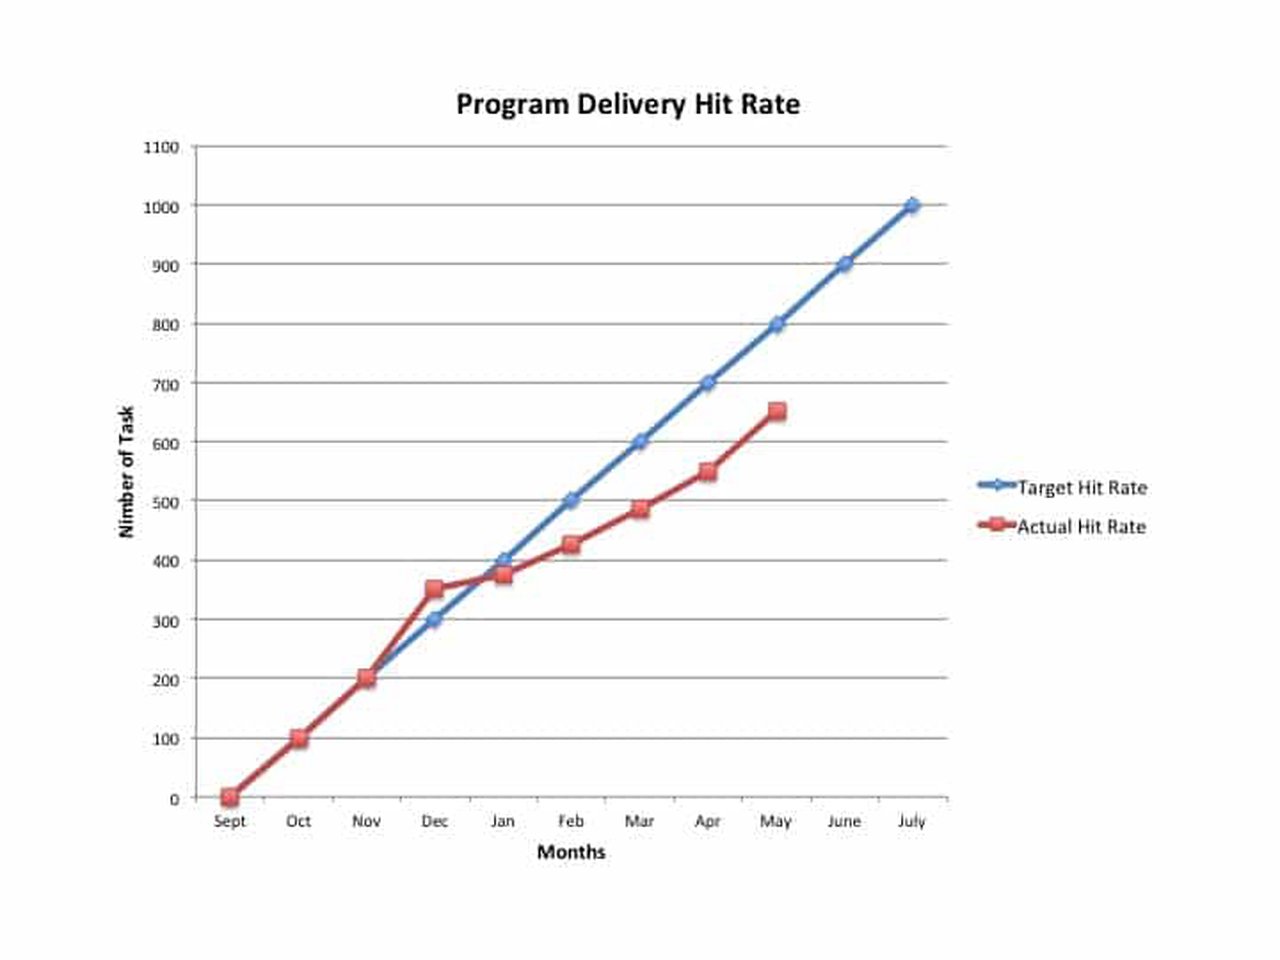
The Deliverable Hit Rate tool manages project cadence by monitoring the progress of completed tasks against a target over time.
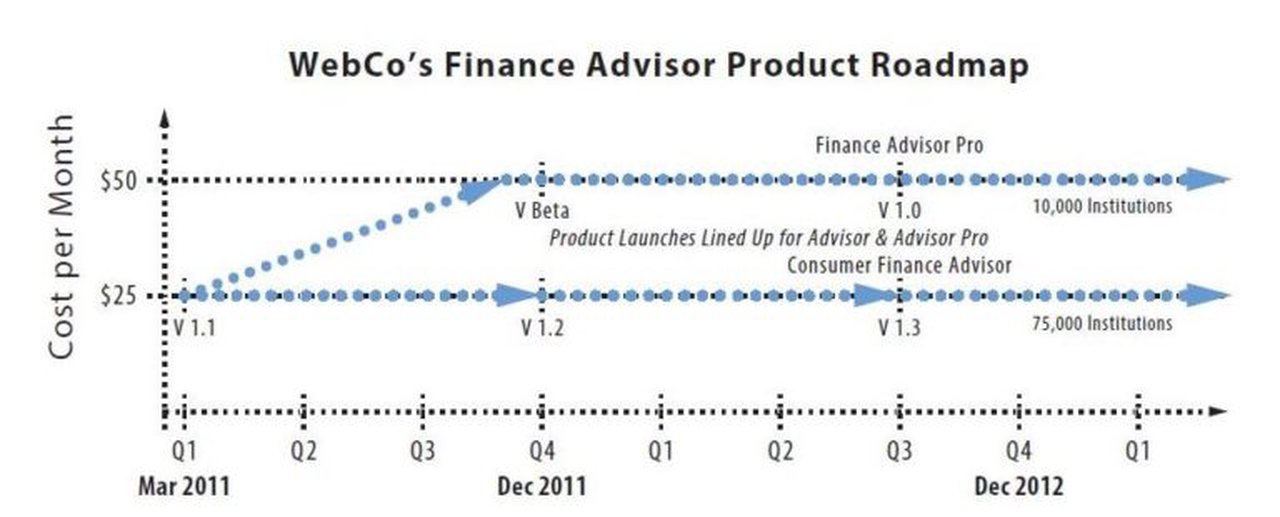
A product roadmap is a graphical representation of a set of related products over time with at most a monthly granularity.
In agile development, the team goes through the whole build/integrate/test cycle with the goal of solving the greatest number of user stories or requirements per build. Tracking the number of user stories completed per build combines many best practices into one easy-to-use system.
New programs spin up every day, but most teams get off to a bad start. In a rush to get going, they forego a few simple steps that would help position their programs for success.

Product Management is often an understaffed, overworked function. And the impact on the organization is huge.
Benchmarking often fails just when you need it most. All the best benchmarking and best practices lead nowhere if they are not implemented.