—— Tools ——
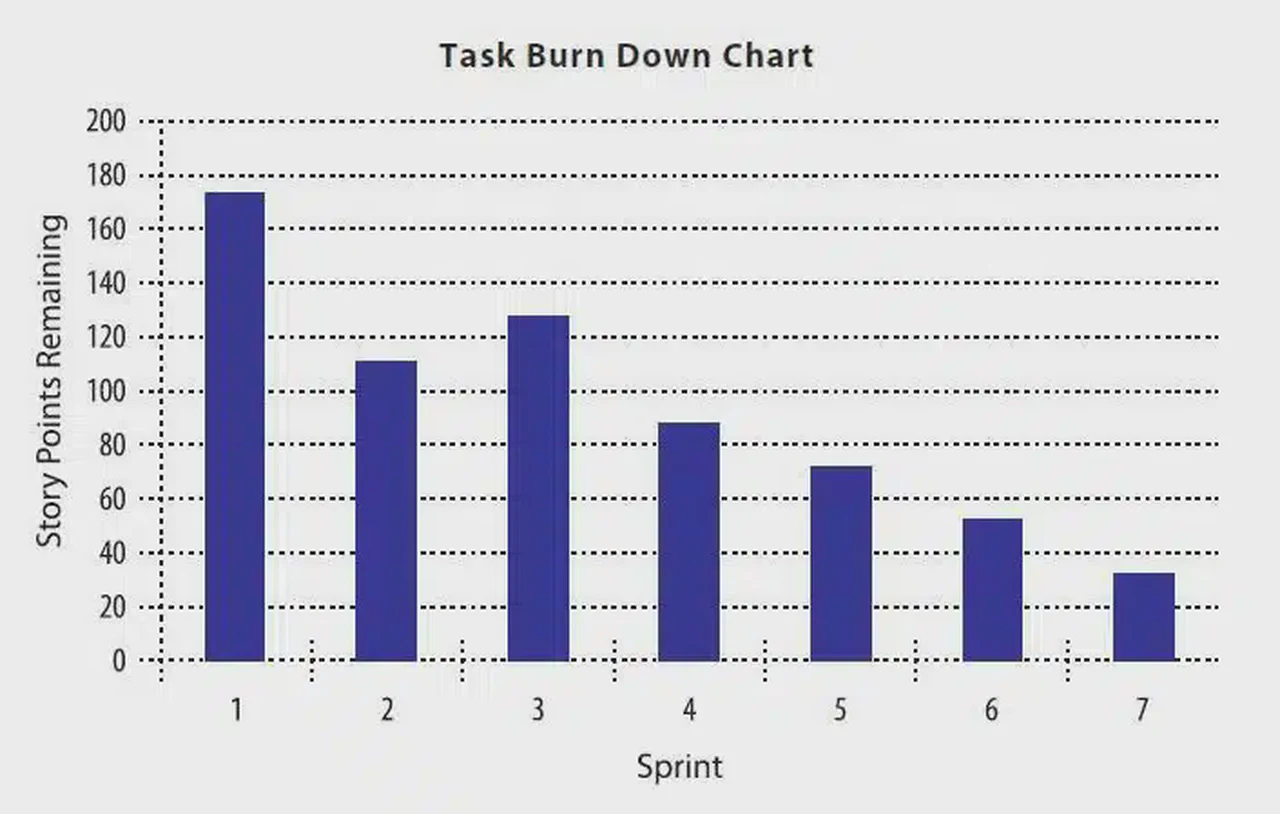
Task Burn Down Chart
Software development has migrated to some degree from the waterfall model, where there is a clear handoff from one stage to the next, to agile development, where iteration of builds is the dominant paradigm. In agile development, the team goes through the whole requirements (build/integrate/test cycle) with the goal of solving the greatest number of user stories or requirements per build. Tracking the number of user stories completed per build as well as displaying them in a graphical format in the team workspace is an emerging practice that combines many best practices in one easy-to-use system. Before defining the burndown graph, we should first describe the agile process. The essence of agile development is turning user stories into code and testing them with a proxy for the customer. Each cycle is called a sprint, with the goal of doing as many use cases (or user stories) as possible in each sprint. As each sprint is completed, a number of user stories are addressed and the team plans the next sprint to make further progress. At the end of each day, the number of use cases accepted by the customer representative on the team is subtracted from the total, and thus the team can see how rapidly they burned down the use cases during the sprint. The team would list the number of use cases over a given sprint period, which indicates the number of use cases per week. This along with the number of sprints would yield the development duration. In order to estimate the length of a given development effort, the project manager would divide the number of user stories by the number of sprints and multiply that by the duration of the sprints. However, things change. The team can knock off more (or fewer) user stories per sprint. The team can have the user stories change, so there are more (or less) to code. This tool allows the team to dynamically estimate the completion date based on the extrapolation of real project data.
Download This Tool
Get the Task-Burn-Down-Chart.xlsx file to start using this tool immediately.
Download Task-Burn-Down-Chart.xlsxFile will download directly to your device. No registration required.