Project Efficiency Chart
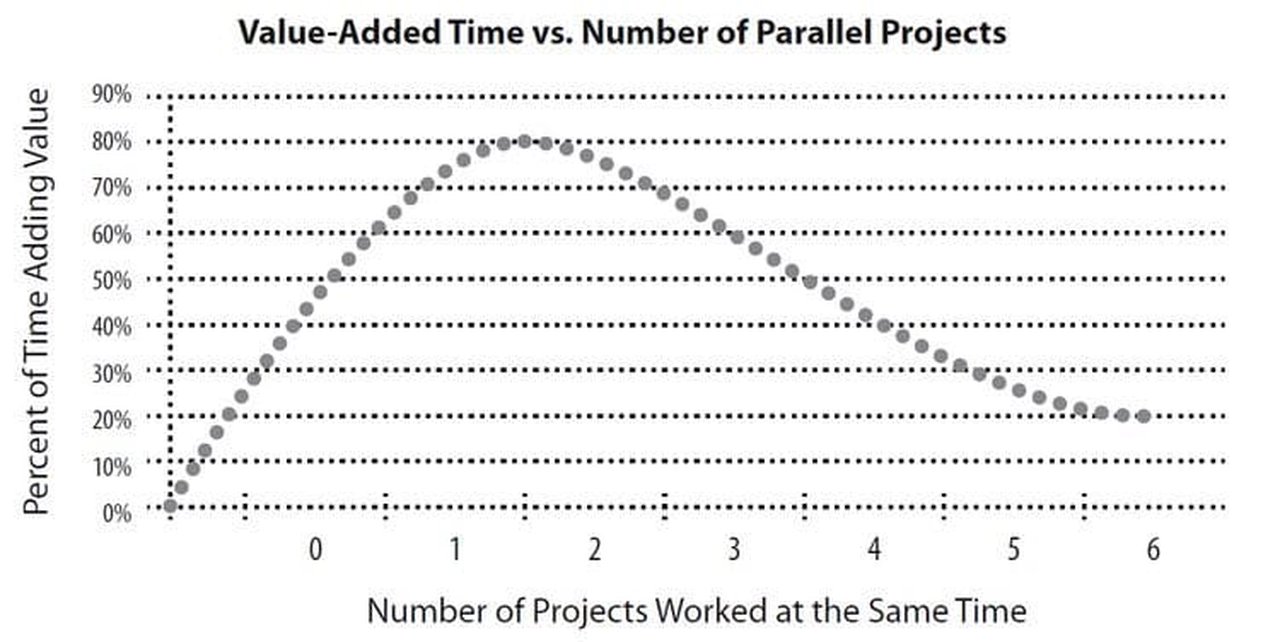
The Project Efficiency Chart estimates the amount of time a project team has available to create useful work output, based on the number of projects per person. It provides a visual map of resource overload and exposes overburdened functions. Staffing Ratio Matrix
Download This Tool
Get the Project-Efficiency-Chart_v1.xlsx file to start using this tool immediately.
Download Project-Efficiency-Chart_v1.xlsxFile will download directly to your device. No registration required.