
Project Escalation Map
Clarifies the boundaries and channels of decision making throughout an organization. Empowers teams, and minimizes the time and attention required by senior managers at the project level.
 Skip to content
 These product development templates are based on real life examples, and have been tested in the field with clients on multiple engagements. We often are stuck when first getting started working on a complex issue, because we don’t know how to take the first step. These graphical tools (graphs, charts, tables, and forms) are ready to go and can be modified for your needs.
Clarifies the boundaries and channels of decision making throughout an organization. Empowers teams, and minimizes the time and attention required by senior managers at the project level.

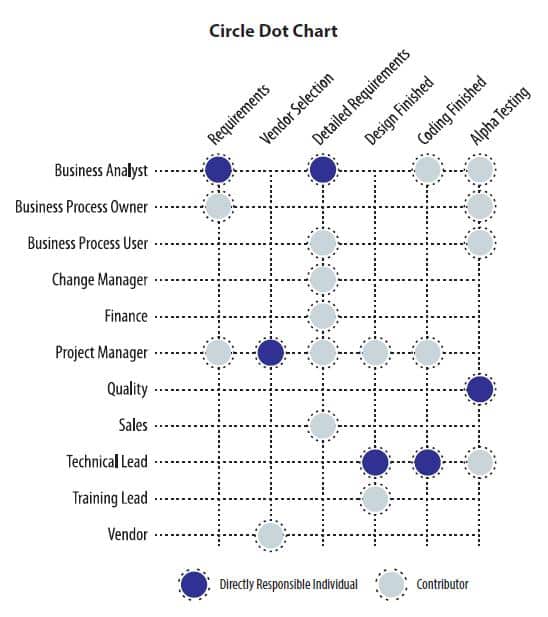
Identifies a team’s leadership, its critical functions, and the individuals who will fulfill these functions. Provides, by name, the functional resources assigned to a project.

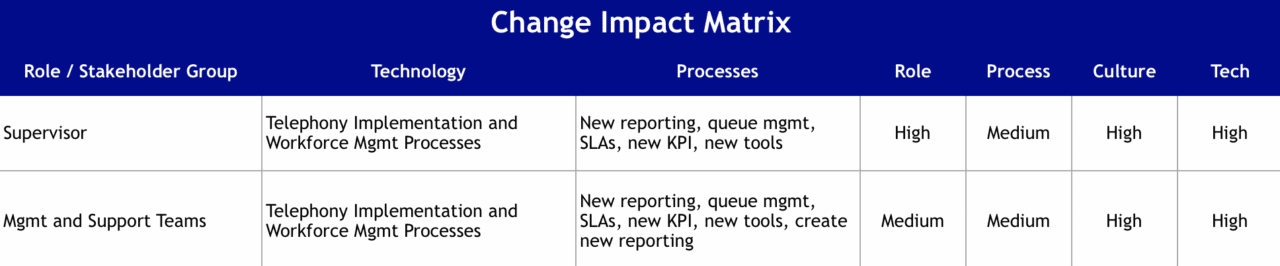
Helps a cross-functional project team to identify project objectives, roles & responsibilities, and key deliverables across the phases of a project. Identifies dependencies between team members and deliverables.
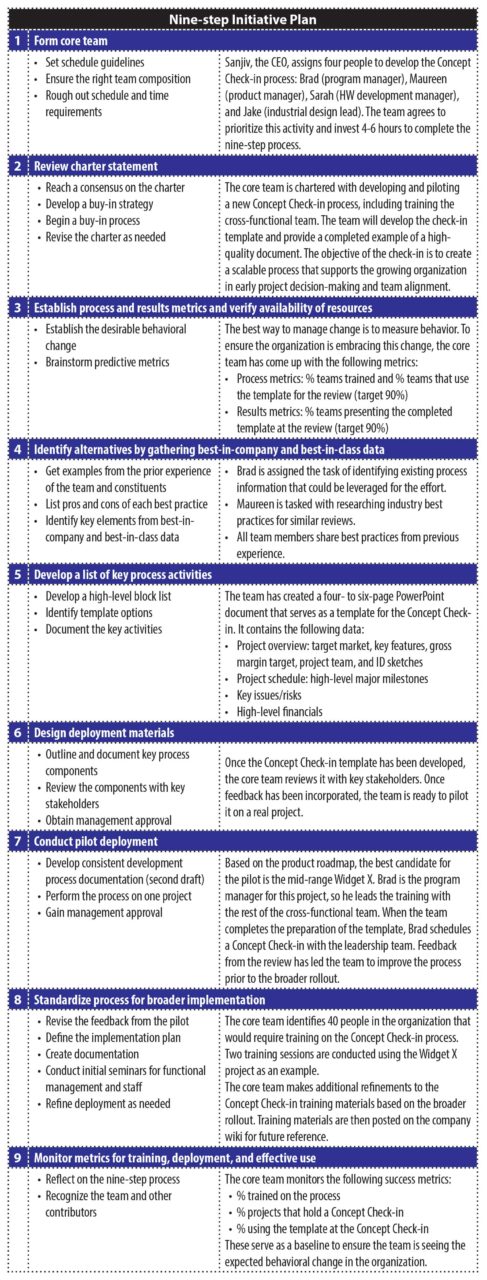
Lists the nine steps to successfully implement a large scale change management program.
A descriptive template that helps project teams prepare for the future and serves as a discussion guide for planning risk-mitigation activities.
Realigns teams after a project has gone out of scope. Provides the team with a mechanism to conduct a root cause analysis, evaluate alternatives, and recommend a remedy to decision makers.
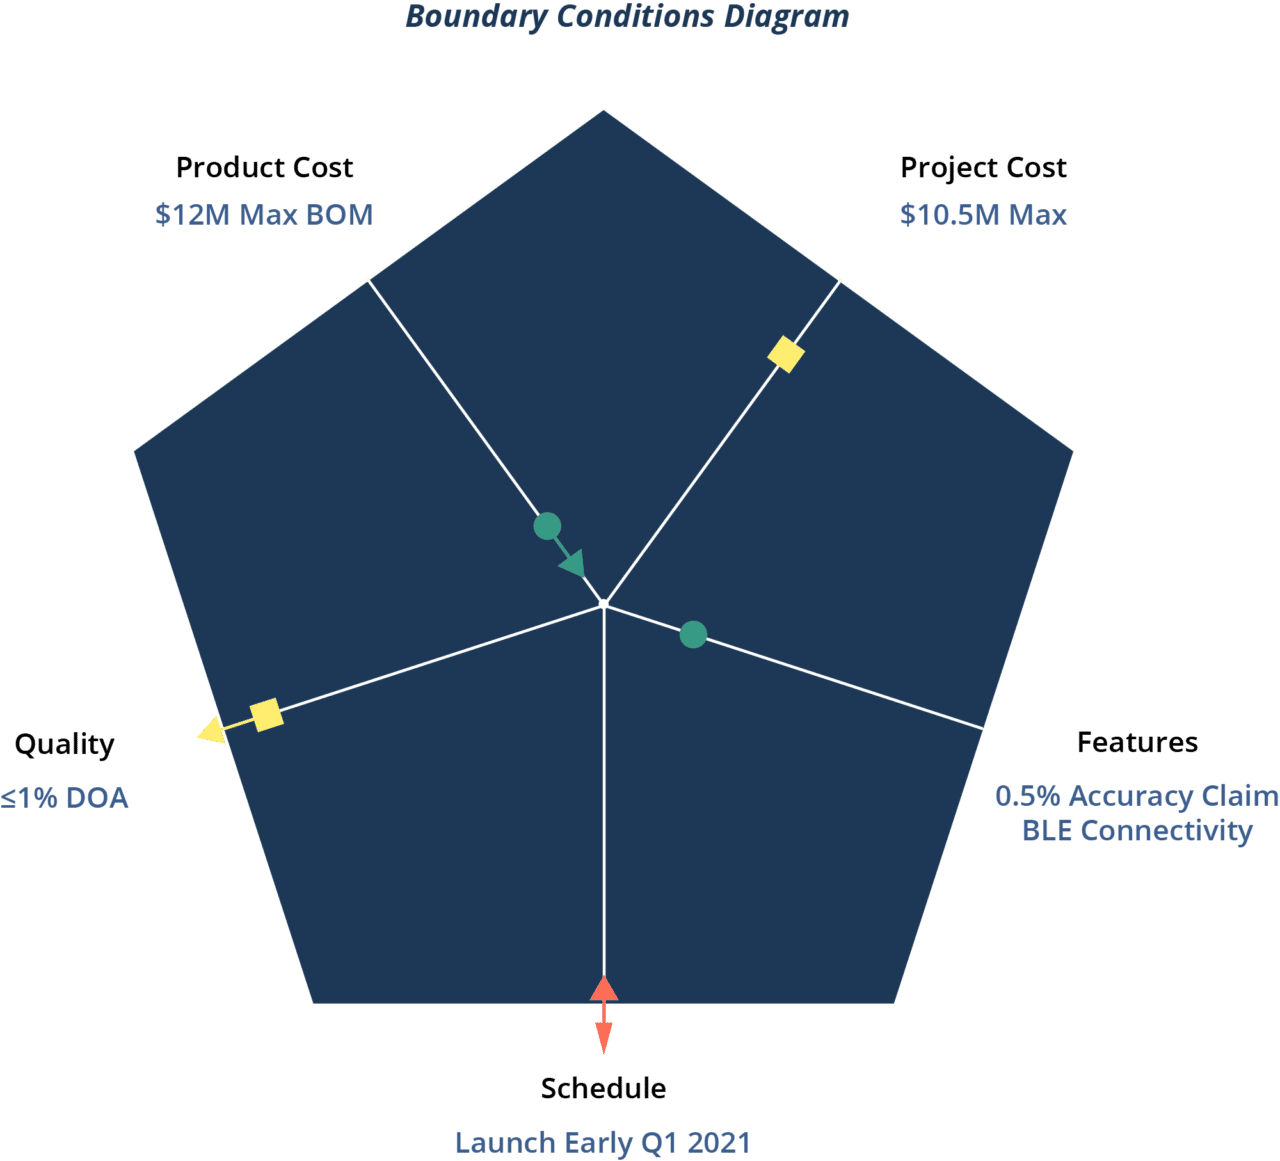
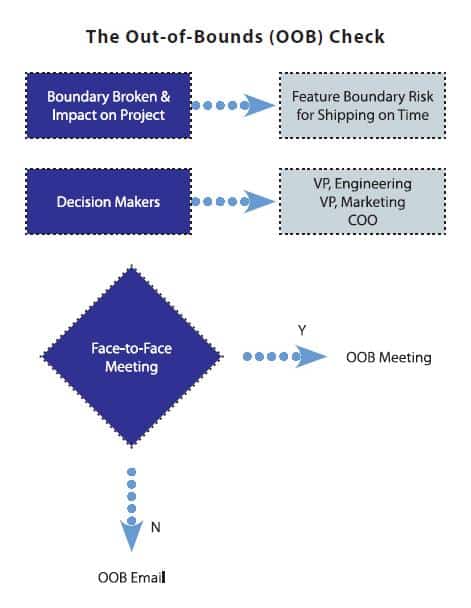
Identifies the critical elements of a project and defines the conditions which must exist for a team to ship a product to market. Enables a team to plan and execute with minimal management intervention.

Helps identify and manage the key individuals who might impede your success by determining your project’s supporters and detractors. Provides a visual map to clarify the political landscape around your team.

Shows the team and management how much progress they are making on a project. An improvement on Gantt Charts in that it focuses on customers, and provides a more accurate estimate of the work performed on a project in-progress.
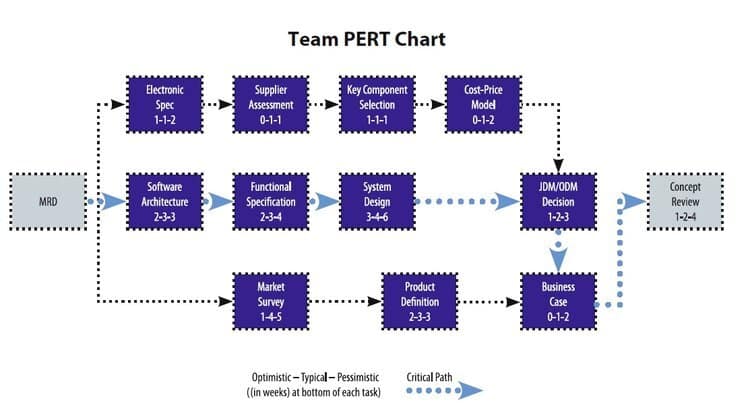
Breaks projects down into tasks, shows the dependencies of one work stream on another, and provides real estimates, created by the people who actually perform the tasks.
Download Team Pert Chart Tool Online. This tool will help you to schedule, organize, and coordinate tasks within a project.
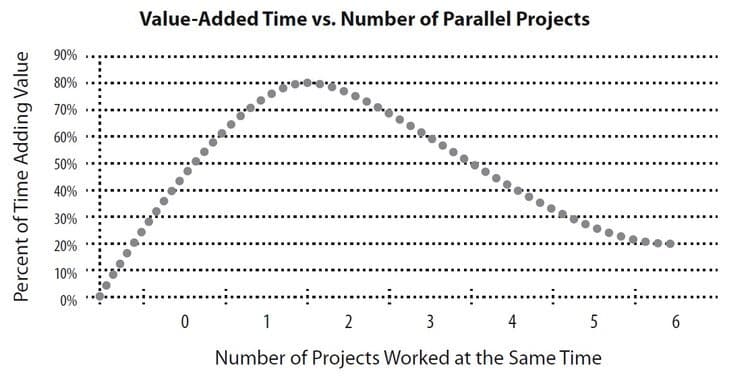
Estimates the amount of time a project team has available to create useful work output, based on the number of projects per person. Provides a visual map of resource overload and exposes overburdened functions.