


—— Knowledge Base ——
How To Use A Schedule Prediction Accuracy Chart
🧭 How to Read a Milestone Slip Chart (Schedule Prediction Accuracy Chart)
A Schedule Prediction Accuracy Chart—also known as a milestone slip chart—is a powerful visual tool for tracking how project milestone forecasts evolve over time. It helps teams identify schedule risks early and assess the reliability of their delivery predictions.
📊 Chart Structure
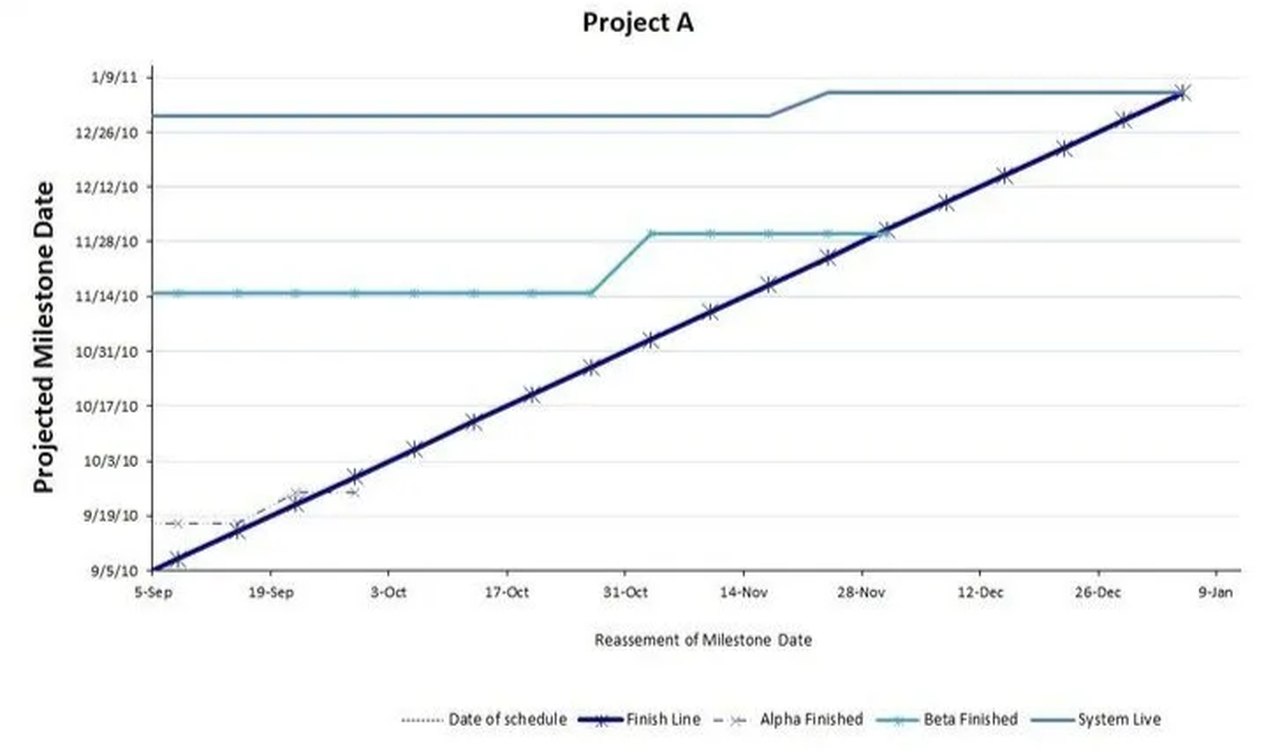
This chart, as illustrated below, is an X-Y scatter plot where:
- X-axis: Represents the date when the forecast was made (e.g., weekly status updates).
- Y-axis: Shows the forecasted completion date for a specific milestone.
Each point on the chart reflects the forecasted delivery date of a milestone at a particular time. By connecting these points over successive reporting periods, you can observe trends in schedule predictions.
📈 Interpreting the Chart
- Flat Line: Indicates consistent forecasts; the milestone’s expected completion date hasn’t changed over time.
- Upward Slope: Suggests the milestone is slipping; each new forecast predicts a later completion date.
- Downward Slope: Implies the milestone is accelerating; forecasts are moving the completion date earlier.
- Diagonal “Finish Line”: Represents the original planned schedule. Deviations from this line highlight changes in the forecast.
By analyzing these trends, project managers can assess the stability of their schedules and identify areas requiring attention.
🔍 Signs of Project Health
Understanding the patterns in a milestone slip chart can provide insights into the project’s health:
✅ Healthy Project Indicators
- Stable Forecasts: Forecasted dates remain consistent over time, indicating reliable planning.
- Minor Adjustments: Small, infrequent changes to forecasts suggest effective risk management.
- On-Time Milestone Completion: Milestones are achieved as initially planned, reflecting good execution.
⚠️ Reasonable Slippage
- Gradual Delays: Forecasts shift slightly over time due to manageable issues.
- Quick Recovery: After a delay, subsequent forecasts return to the original schedule, showing adaptability.
- Transparent Communication: Delays are communicated promptly with clear reasons and mitigation plans.
🚨 Off-Course Indicators
- Consistent Upward Trends: Forecasted dates continuously slip, signaling unresolved issues.
- Sudden Large Shifts: Significant changes in forecasts without clear explanations may indicate deeper problems.
- Lack of Recovery: No corrective actions are evident after delays, suggesting poor project control.
Recognizing these patterns early allows teams to address issues proactively and steer the project back on course.
✅ Benefits of Using During Project
- Early Warning: Detects schedule risks before they become critical issues.
- Transparency: Provides a clear visual representation of how forecasts change over time.
- Accountability: Encourages teams to maintain accurate and realistic schedules.
- Portfolio Management: Useful for comparing schedule performance across multiple projects.
For more details and a downloadable template, visit TCGen’s Schedule Prediction Accuracy Chart.
🕙 Benefits of Using It Retroactively
- Postmortem Insight: Reveals when slippage began and how forecast evolved over time.
- Root Cause Discovery: Helps identify where and why delays happened.
- Better Forecasting: Informs future estimates by showing how past predictions aligned (or didn’t) with reality.
- Transparency & Accountability: Provides a neutral, visual record of schedule changes—useful for both internal learning and external storytelling.
- Supports Continuous Improvement: Offers clear evidence to refine planning processes and risk management.