 Skip to content
 Product Portfolio Management
Product Portfolio management defines the direction of a company’s innovation, allowing teams to discover new categories that delight customers.
Learn More
Product Definition
Defining new products involves deep customer knowledge and the ability to probe beyond what customers say they want, to serve their needs.
Learn More
High Performance Teams
Our model, built around project boundary conditions, creates a culture of trust, creativity and innovation — with minimal management interference.
Learn More
Agile for Hardware
A selected and modified set of Ceremonies, Rituals and Roles can create Agile organizations with minimal conflict.
Learn More
Product Development Process
Lean product development processes are based on empowerment and trust. Management’s goals are served when team leaders own projects.
Learn More
Product Development Metrics
Effective product development metrics track the critical few factors that allow teams to make better decisions.
Learn More
View All Tools Available for Download:
Product Strategy and Portfolio Management

Comparative Funding Model
Helps shift the debate about funding new innovation projects, from the political to the strategic.
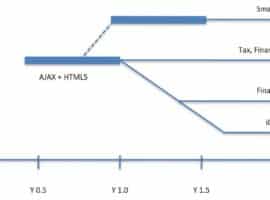
Product Derivative Chart
Shows the lifecycle of the platform and its family of derivatives, indicating the relationships between these derivatives, in terms of cost, performance, quality, or feature density.

Product Development Strategy Process
Download Yearly Strategic Product Plan Online. This tool will help you to create a plan to manage the front end of innovation, and create a strong product portfolio.
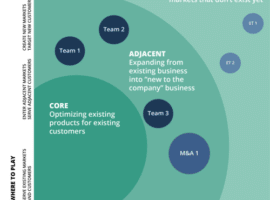
Product Portfolio Management Framework
The Product Portfolio Management Map enables an intentional allocation of R&D and Marketing investments that realizes a risk/reward mix as determined by overall corporate strategy.

Product Radar Chart
Offers a way to evaluate and communicate the factors that go into product and portfolio decisions; facilitates product assessments and helps compare the feasibility of competing product ideas.
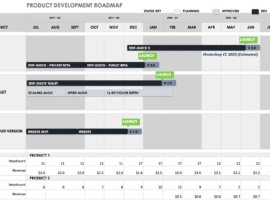
Product Roadmap
A visual explanation of a company’s strategy. Helps align engineering, marketing, sales, support, and the C-suite around common product development goals.
Product Vision & Selection Criteria Tool
The Product Vision & Selection Criteria tool offers a way to evaluate the many factors that go into product and portfolio decisions by ensuring their alignment with the strategy, and ability to meet key goals.
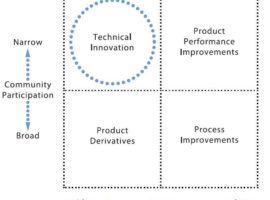
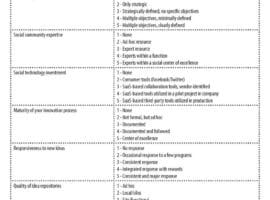
Social Community Matrix
Social communities help product developers crowdsource innovative solution. This tool helps construct effective communities that lead to innovations based on customer and expert input.
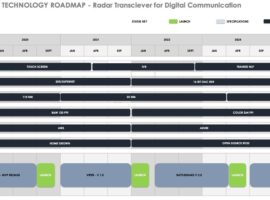
Technology Roadmap
Technology Roadmaps help teams determine which technologies to incorporate into a given product. They help anticipate risks by enabling a degree of visibility into the future.
Product Development Metrics
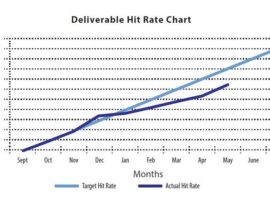
Deliverable Hit Rate Chart
Monitors the progress of completed tasks against a target over time. Indicates whether programs are staying on schedule by tracking the rate of task completion.

Project Efficiency Chart
Estimates the amount of time a project team has available to create useful work output, based on the number of projects per person. Provides a visual map of resource overload and exposes overburdened functions.
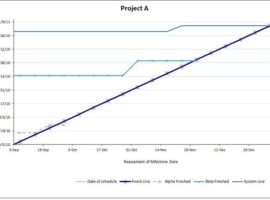
Schedule Prediction Accuracy Chart
Provides an early warning when a project fails to hit the schedule. Allows project teams to anticipate problems before they occur, and to intervene before projects get behind.
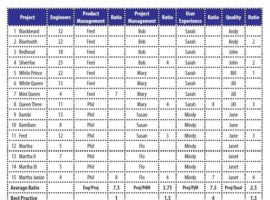
Staffing Ratio Matrix
Identifies overloaded individual contributors and functional bottlenecks. Indicates the relative number of projects per function, enabling better resource allocation and faster new product development projects.
Product Development Process

Circle Dot Chart
Download Team Pert Chart Tool Online. This tool will help you to schedule, organize, and coordinate tasks within a project.
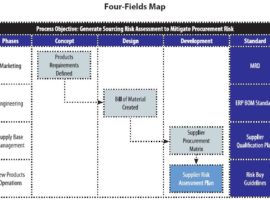
Four-Fields Map
A graphical technique most commonly applied to cross-functional processes. Emphasizes the elements of task, teamwork, and quality, with a focus on how you do the work rather than on what work to do.
Lite and Precise Schedule Estimating Matrices
Is a parametric tool that helps estimate the time to complete a given phase of a project. Creates a rough estimate using past experience combined with the critical few key drivers.
Root Cause Diagram
A framework that helps you discover the ultimate cause of any outcome. Helps individuals or groups discover the root causes that led to a specific outcome in a product development team.
Schedule Prediction Accuracy Chart
Provides an early warning when a project fails to hit the schedule. Allows project teams to anticipate problems before they occur, and to intervene before projects get behind.
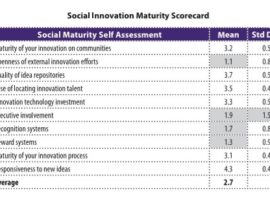
Social Innovation Maturity Scorecard
Helps determine your organization’s maturity level relative to best practices in crowdsourcing innovation.
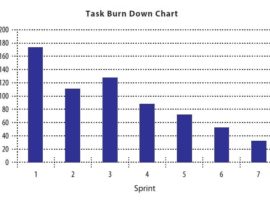
Task Burn Down Chart
Shows the team and management how much progress they are making on a project. An improvement on Gantt Charts in that it focuses on customers, and provides a more accurate estimate of the work performed on a project in-progress.
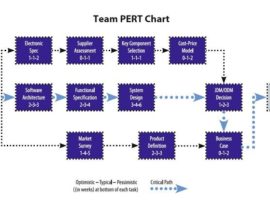
Team PERT Chart
Breaks projects down into tasks, shows the dependencies of one work stream on another, and provides real estimates, created by the people who actually perform the tasks.
Product Definition
Product Derivative Chart
Shows the lifecycle of the platform and its family of derivatives, indicating the relationships between these derivatives, in terms of cost, performance, quality, or feature density.
Product Radar Chart
Offers a way to evaluate and communicate the factors that go into product and portfolio decisions; facilitates product assessments and helps compare the feasibility of competing product ideas.
Product Roadmap
A visual explanation of a company’s strategy. Helps align engineering, marketing, sales, support, and the C-suite around common product development goals.
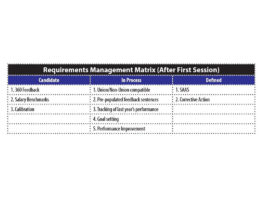
Requirements Management Matrix
A light weight tool to help ensure that key product requirements are well-defined and understood.
Social Innovation Maturity Scorecard
Helps determine your organization’s maturity level relative to best practices in crowdsourcing innovation.
Social Innovation Readiness Scorecard
A decision-making tool that provides executives and teams with an objective view of their organization’s capability to implement social solutions for product innovation.
Process Improvement
Circle Dot Chart
Download Team Pert Chart Tool Online. This tool will help you to schedule, organize, and coordinate tasks within a project.
Four-Fields Map
A graphical technique most commonly applied to cross-functional processes. Emphasizes the elements of task, teamwork, and quality, with a focus on how you do the work rather than on what work to do.
Lite and Precise Schedule Estimating Matrices
Is a parametric tool that helps estimate the time to complete a given phase of a project. Creates a rough estimate using past experience combined with the critical few key drivers.
Root Cause Diagram
A framework that helps you discover the ultimate cause of any outcome. Helps individuals or groups discover the root causes that led to a specific outcome in a product development team.
Schedule Prediction Accuracy Chart
Provides an early warning when a project fails to hit the schedule. Allows project teams to anticipate problems before they occur, and to intervene before projects get behind.
Social Innovation Maturity Scorecard
Helps determine your organization’s maturity level relative to best practices in crowdsourcing innovation.
Task Burn Down Chart
Shows the team and management how much progress they are making on a project. An improvement on Gantt Charts in that it focuses on customers, and provides a more accurate estimate of the work performed on a project in-progress.
Team PERT Chart
Breaks projects down into tasks, shows the dependencies of one work stream on another, and provides real estimates, created by the people who actually perform the tasks.
High Performance Teams
Attitude Influence Diagram
Helps identify and manage the key individuals who might impede your success by determining your project’s supporters and detractors. Provides a visual map to clarify the political landscape around your team.
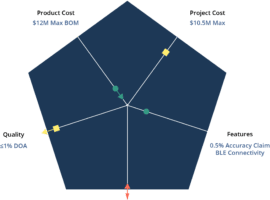
Boundary Conditions Diagram
Identifies the critical elements of a project and defines the conditions which must exist for a team to ship a product to market. Enables a team to plan and execute with minimal management intervention.

Change Impact Matrix
A descriptive template that helps project teams prepare for the future and serves as a discussion guide for planning risk-mitigation activities.
Circle Dot Chart
Download Team Pert Chart Tool Online. This tool will help you to schedule, organize, and coordinate tasks within a project.

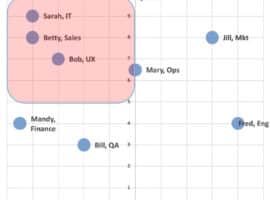
Cross Functional Team Model
Identifies a team’s leadership, its critical functions, and the individuals who will fulfill these functions. Provides, by name, the functional resources assigned to a project.
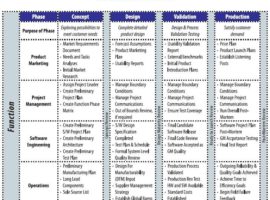
Function Phase Matrix
Helps a cross-functional project team to identify project objectives, roles & responsibilities, and key deliverables across the phases of a project. Identifies dependencies between team members and deliverables.
Nine-step Initiative Plan
Lists the nine steps to successfully implement a large scale change management program.
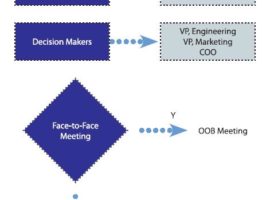
Out-of-Bounds Check
Realigns teams after a project has gone out of scope. Provides the team with a mechanism to conduct a root cause analysis, evaluate alternatives, and recommend a remedy to decision makers.
Project Efficiency Chart
Estimates the amount of time a project team has available to create useful work output, based on the number of projects per person. Provides a visual map of resource overload and exposes overburdened functions.

Project Escalation Map
Clarifies the boundaries and channels of decision making throughout an organization. Empowers teams, and minimizes the time and attention required by senior managers at the project level.
Task Burn Down Chart
Shows the team and management how much progress they are making on a project. An improvement on Gantt Charts in that it focuses on customers, and provides a more accurate estimate of the work performed on a project in-progress.
Team PERT Chart
Breaks projects down into tasks, shows the dependencies of one work stream on another, and provides real estimates, created by the people who actually perform the tasks.
Agile
Boundary Conditions Diagram
Identifies the critical elements of a project and defines the conditions which must exist for a team to ship a product to market. Enables a team to plan and execute with minimal management intervention.
Deliverable Hit Rate Chart
Monitors the progress of completed tasks against a target over time. Indicates whether programs are staying on schedule by tracking the rate of task completion.
Out-of-Bounds Check
Realigns teams after a project has gone out of scope. Provides the team with a mechanism to conduct a root cause analysis, evaluate alternatives, and recommend a remedy to decision makers.
Project Escalation Map
Clarifies the boundaries and channels of decision making throughout an organization. Empowers teams, and minimizes the time and attention required by senior managers at the project level.
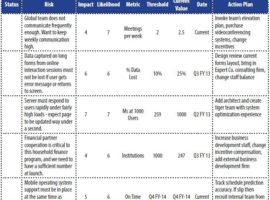
Risk Management Matrix
Helps anticipate, manage, and mitigate product development risks. Prompts the team to identify risks, to rate their potential impact, and to create action plans to mitigate them.