High Performance Teams Tools
These product development templates are based on real life examples, and have been tested in the field with clients on multiple engagements. We often are stuck when first getting started working on a complex issue, because we don’t know how to take the first step. These graphical tools (graphs, charts, tables, and forms) are ready to go and can be modified for your needs.
Click the links below to view spreadsheet-based templates that describe the tool, its benefits and how to apply it. The tools are downloadable free of charge. Download them, share them, use them in your organization.

Attitude Influence Diagram
Help identify and manage the key individuals who might impede your success by determining your project's supporters and detractors. This product development process tool is a subjective assessment tha...
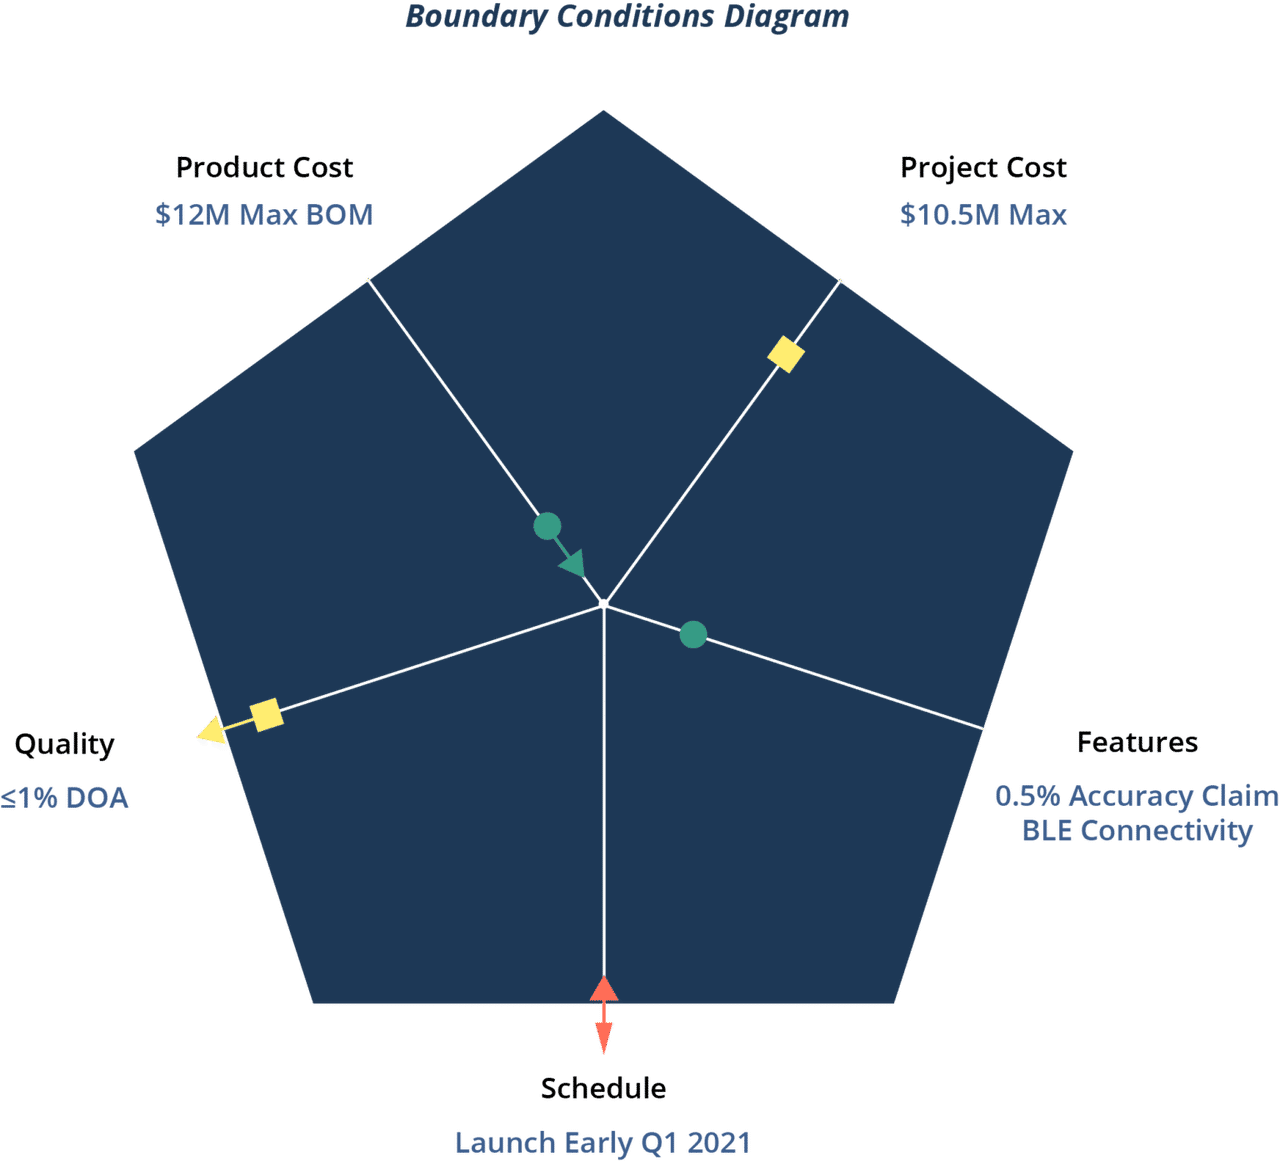
Boundary Conditions Diagram
Identifies the critical elements of a project and defines the conditions which must exist for a team to ship a product to market. Enables a team to plan and execute with minimal management intervention.

Change Impact Matrix
A descriptive template that helps project teams prepare for the future and serves as a discussion guide for planning risk-mitigation activities.
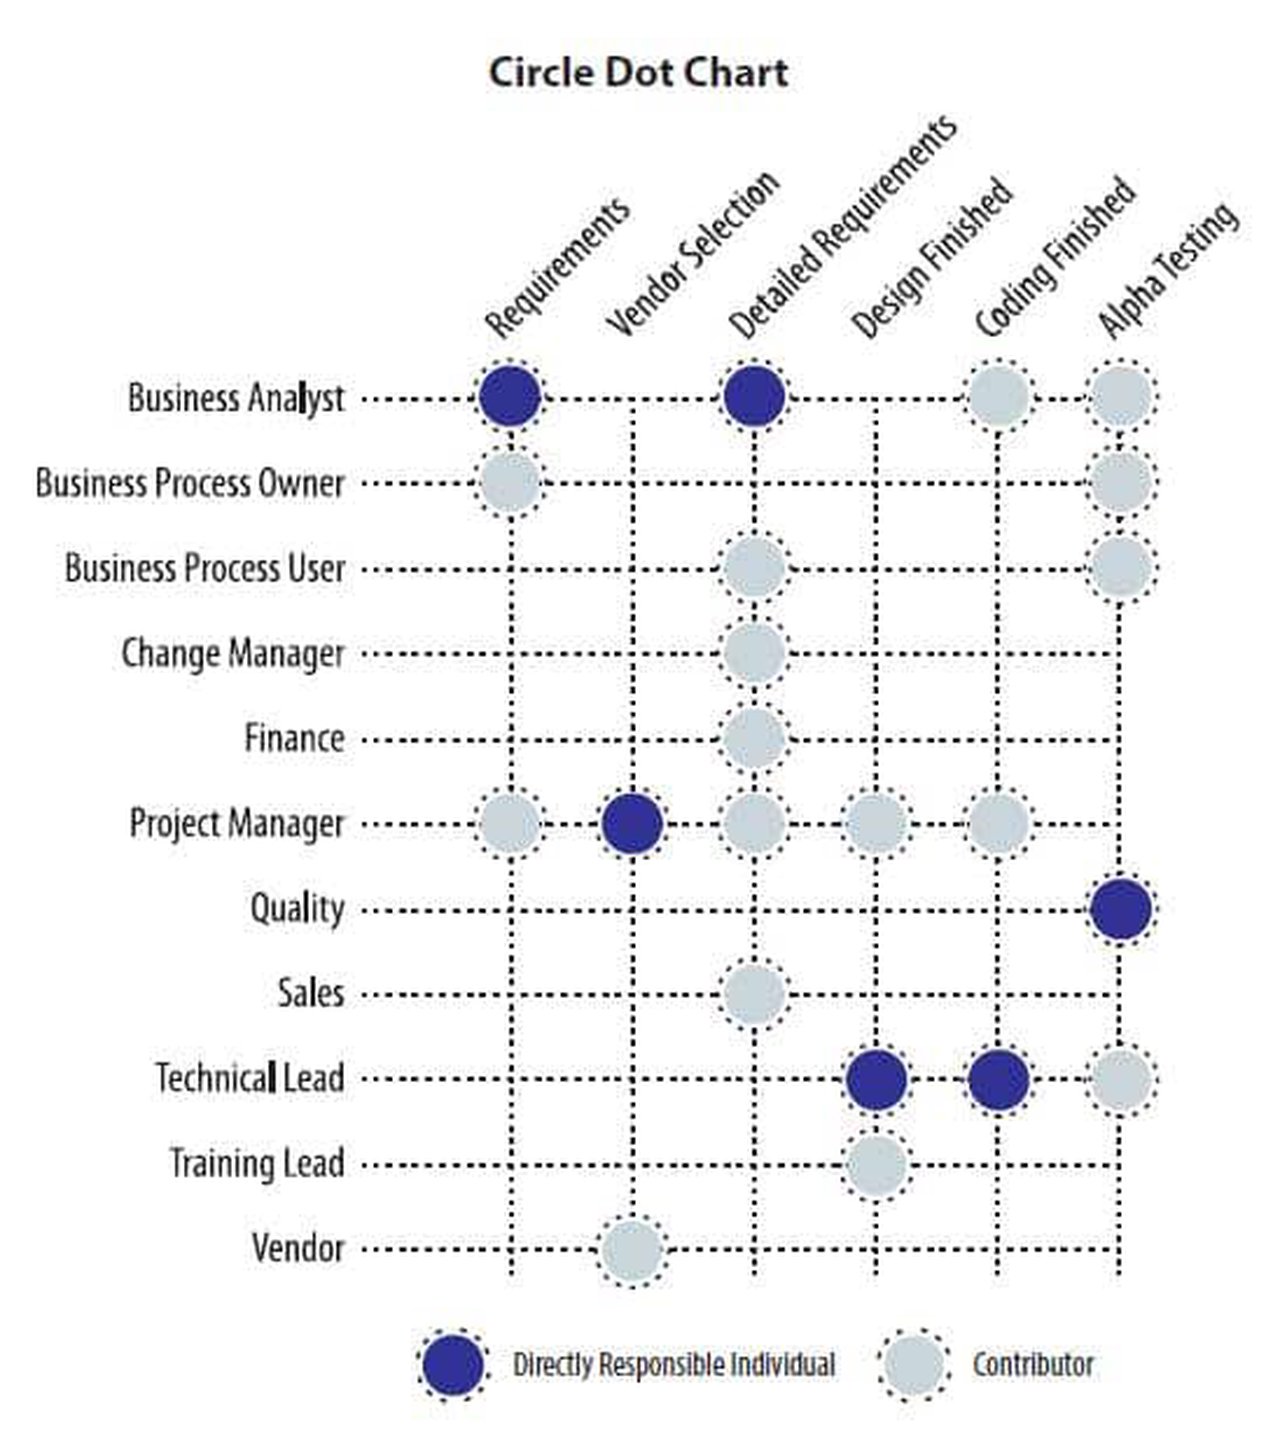
Circle Dot Chart
This simplified RACI helps you clarify who owns what decisions within a project.
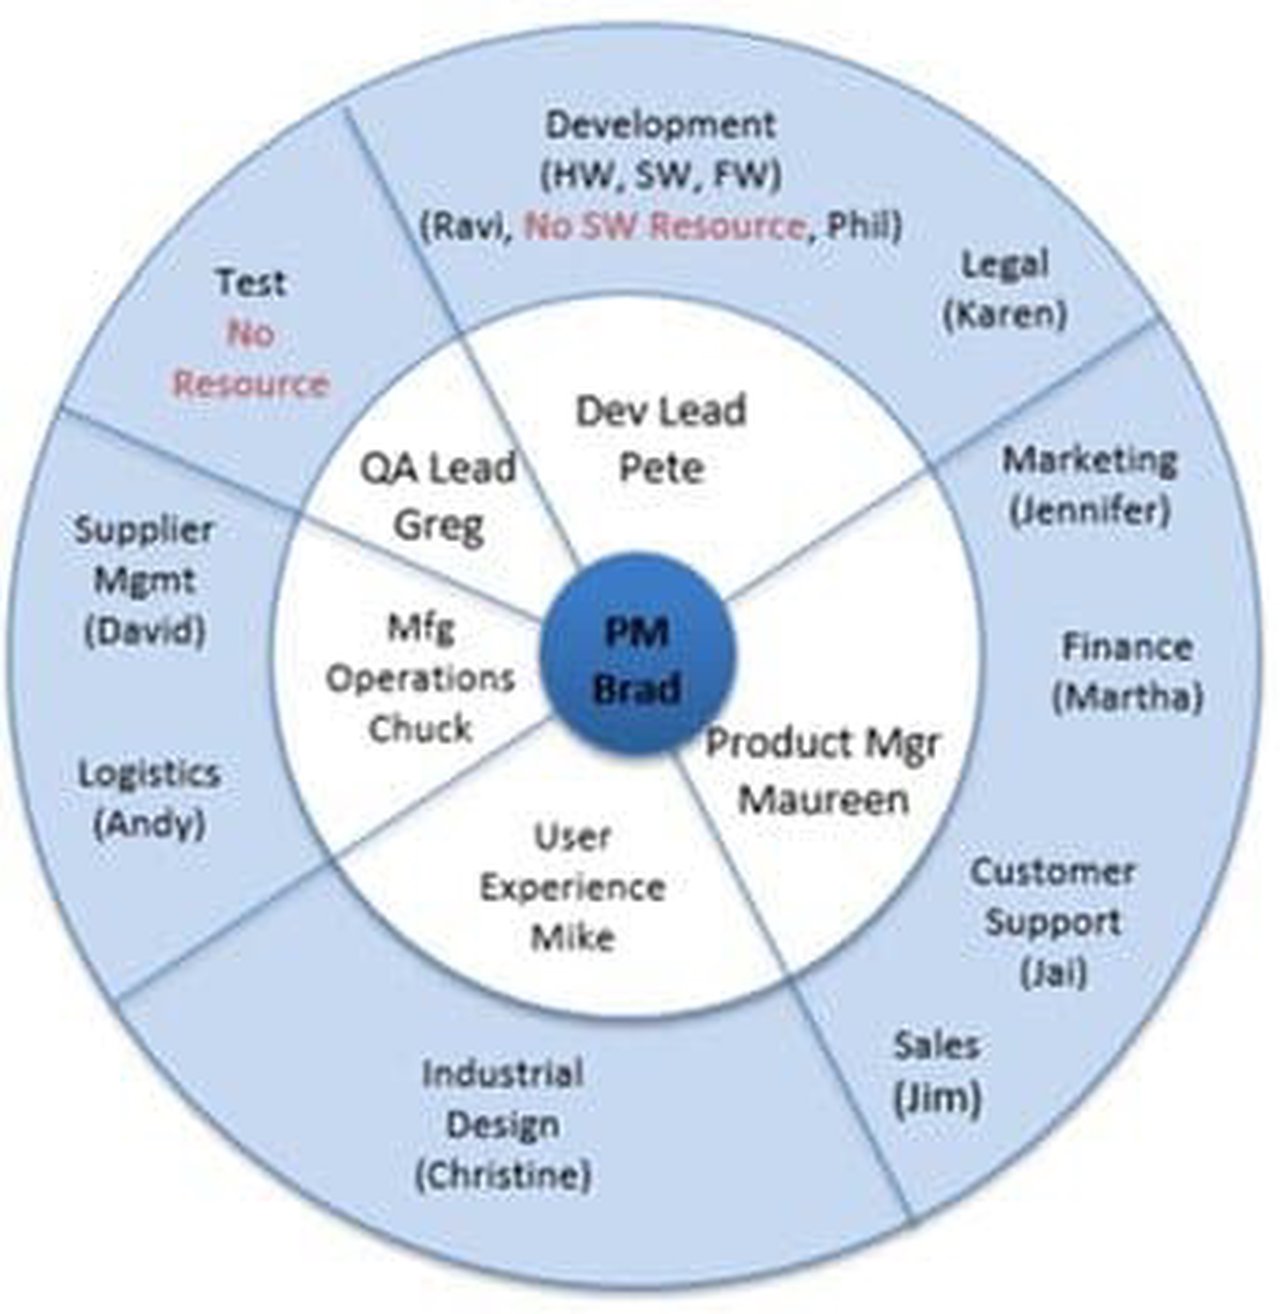
Cross Functional Team Model
The Cross Functional Team Model is a tool to identify the leadership, critical functions, and key individuals in a cross functional team. It is a snapshot that identifies, by name, the functional reso...
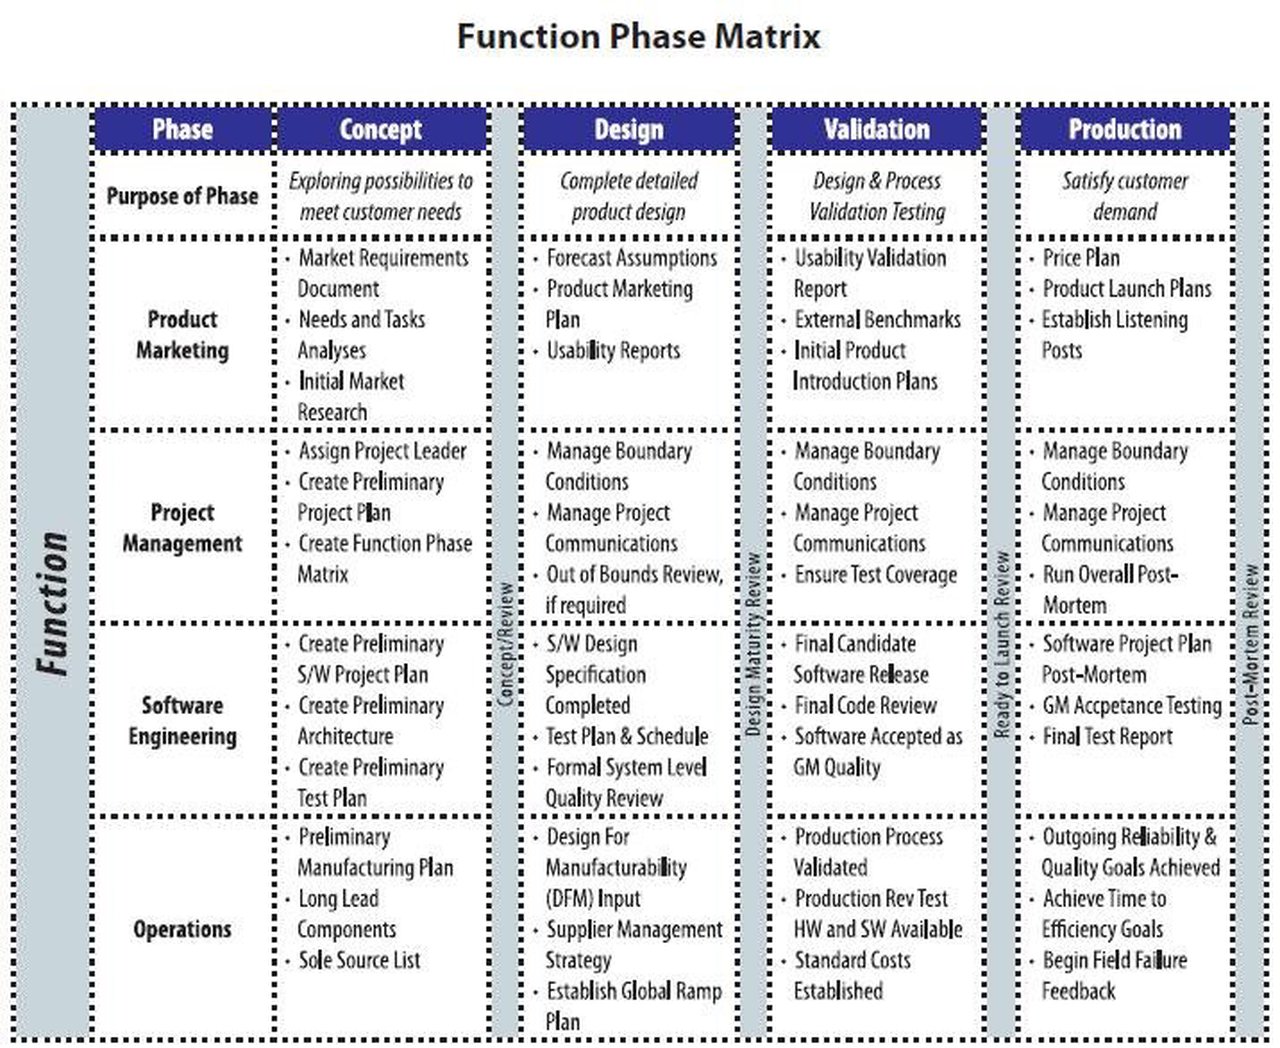
Function Phase Matrix
Helps a cross-functional project team to identify project objectives, roles & responsibilities, and key deliverables across the phases of a project. Identifies dependencies between team members and deliverables.

Innovate Products Faster
Graphical Tools for Accelerating Product Development
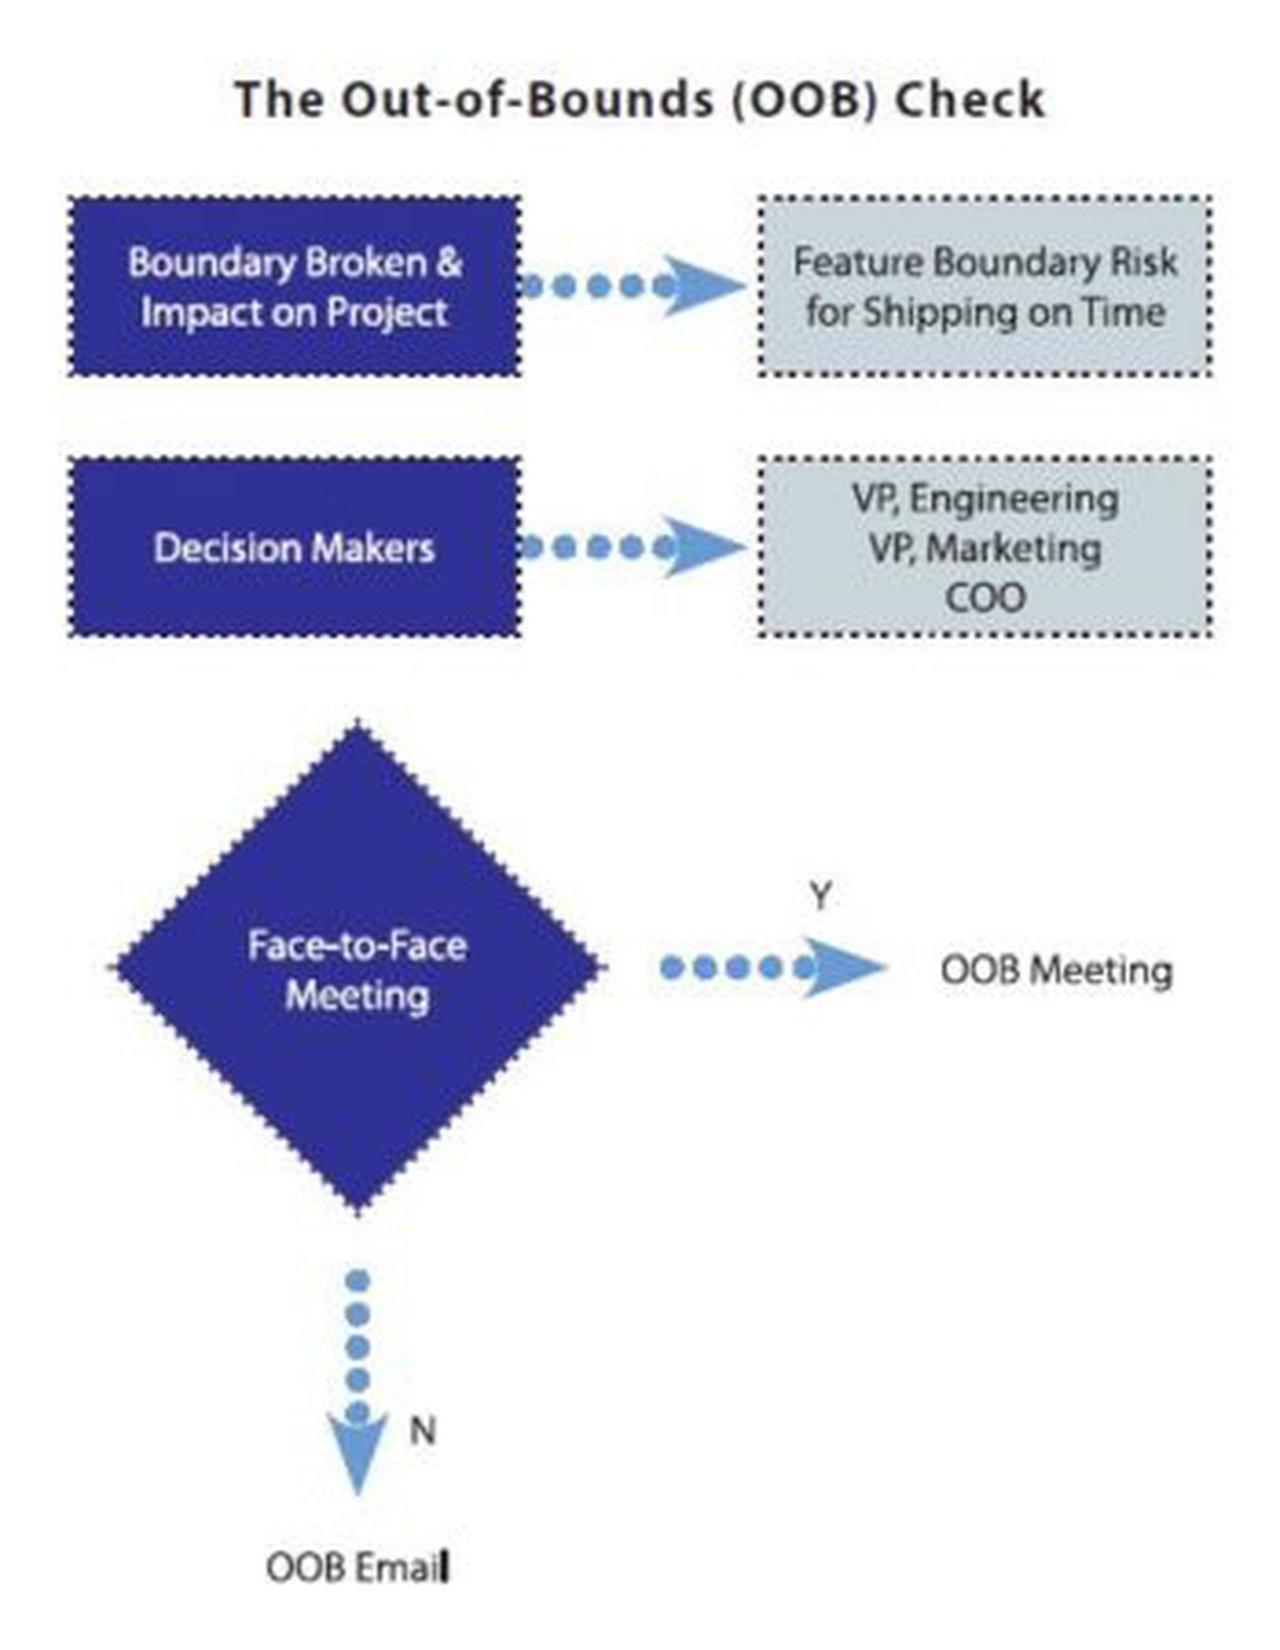
Out-of-Bounds Check
Realigns teams after a project has gone out of scope. Provides the team with a mechanism to conduct a root cause analysis, evaluate alternatives, and recommend a remedy to decision makers.
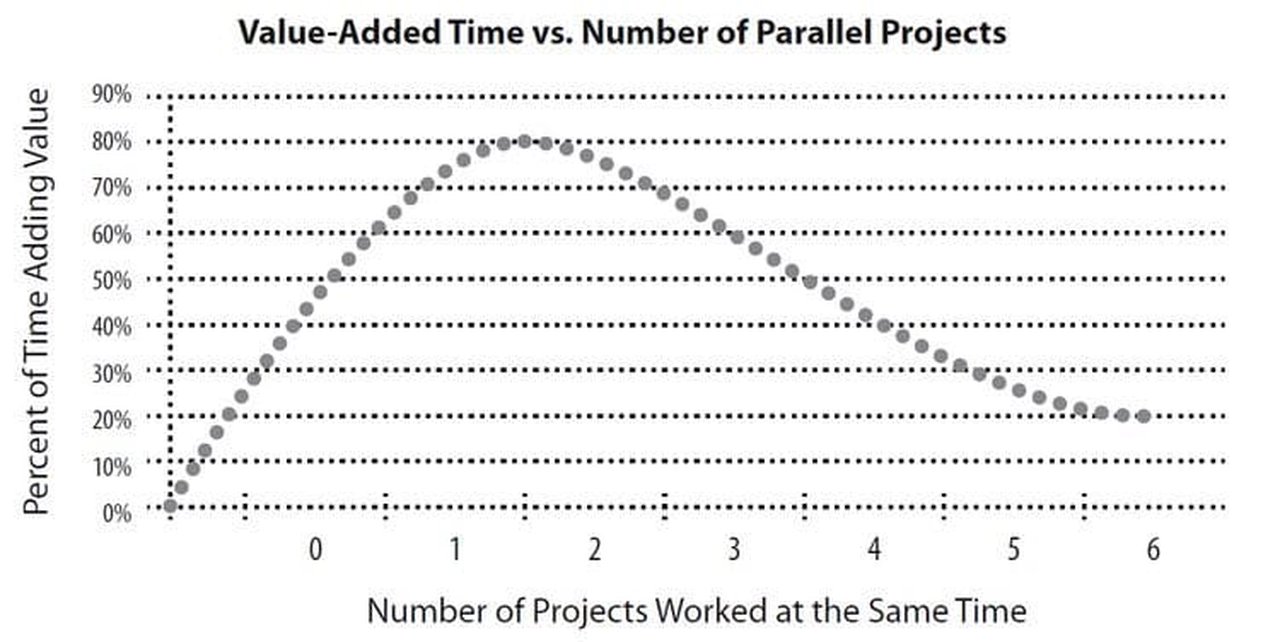
Project Efficiency Chart
Estimates the amount of time a project team has available to create useful work output, based on the number of projects per person. Provides a visual map of resource overload and exposes overburdened functions.
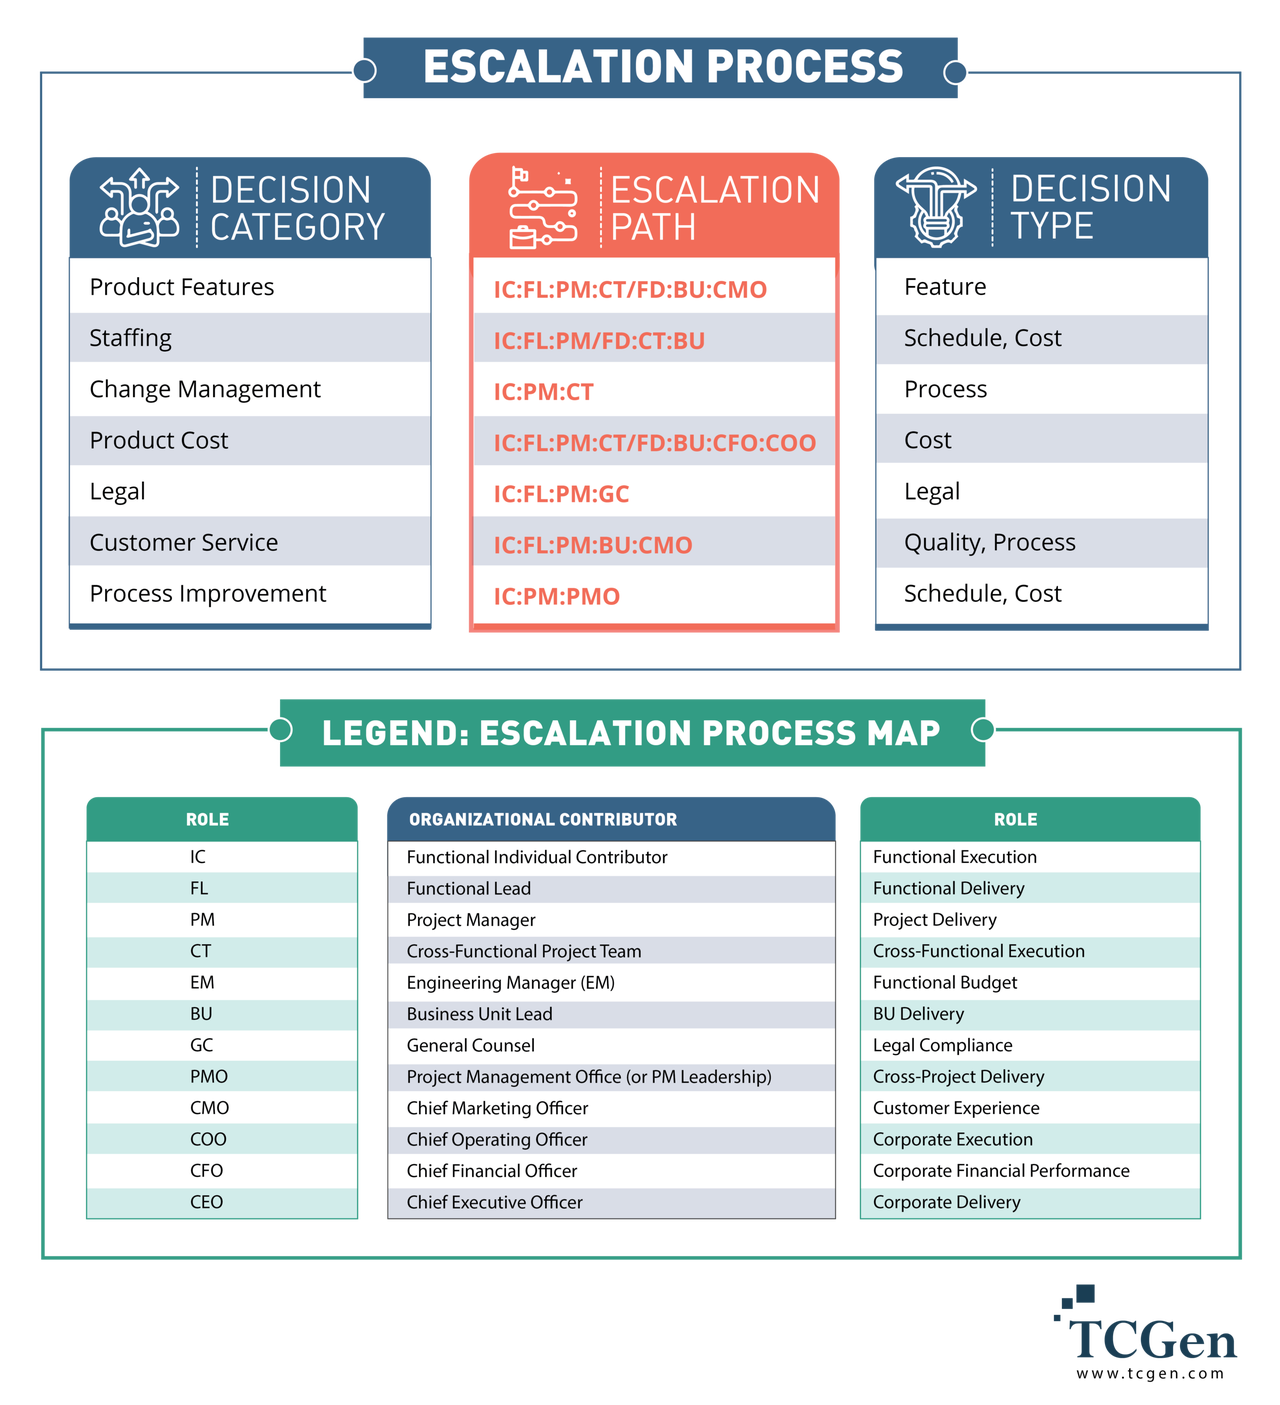
Project Escalation Map
Clarifies the boundaries and channels of decision making throughout an organization. Empowers teams, and minimizes the time and attention required by senior managers at the project level.
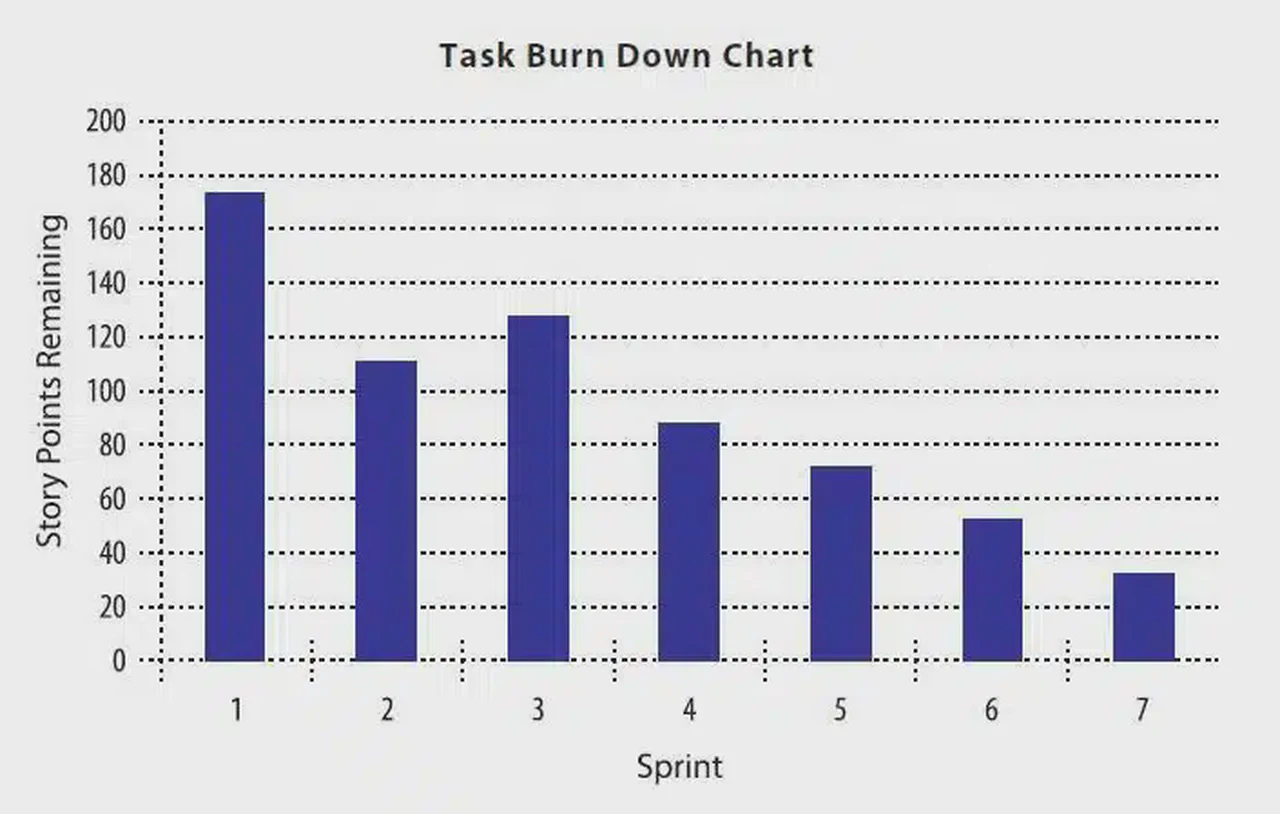
Task Burn Down Chart
Shows the team and management how much progress they are making on a project. An improvement on Gantt Charts in that it focuses on customers, and provides a more accurate estimate of the work performed on a project in-progress.

Team PERT Chart
Breaks projects down into tasks, shows the dependencies of one work stream on another, and provides real estimates, created by the people who actually perform the tasks.