Skip to content
 What is the Improvement Forecaster?
The Half-Life Diagram consists of an equation, and a graphical plot of expected improvement over time. The Half-Life Diagram uses estimated degrees of technical and organizational complexity (high, middle, and low) as an input to the model and based on research of prior programs, then estimates the rate of improvement based on similar projects out of a study of nearly 100 programs*.
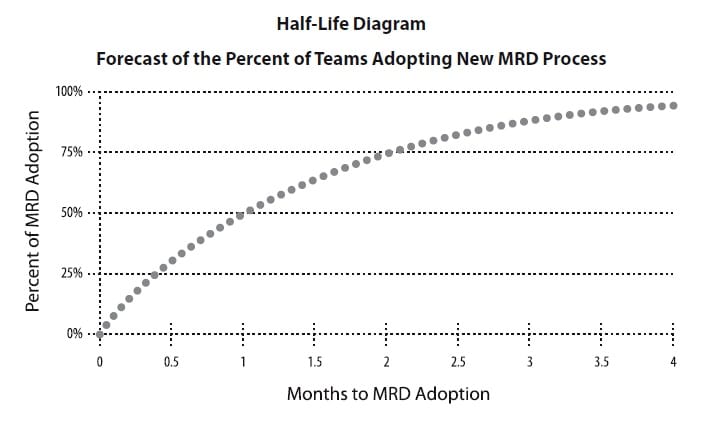
This Half-Life Diagram generates a target curve over time that a project team can use to gauge its progress. Although most of the applications of this tool come from process improvement and change management initiatives, there are many other areas where it can be applied – either in spirit or by exact application. Based on the technical and organizational complexity inputs, the output is a continuous graph that shows the projected improvement assuming that the improvement can be characterized by a relationship of constant percentage improvement – so the rate of improvement remains constant. This is typical of most initiatives where you would expect say 50% improvement per time period, period over period. If this time period for a 50% improvement is one month, after 4 months you would have accumulated a total improvement of 92%. The time to get to 50% improvement is called the ‘half life’ since it is the time required to cut the errors by half.
Teams and management can use this for tracking interim progress, and to take action before it is too late.
Improvement Forecaster. What are the Benefits?
- Provide a visual target curve
- Does not require a lot of up front planning
- Best applications are where you are doing something not done before
- Easy and relatively accurate
- Forces the team to continuously monitor progress and compare against a standard
What Business Problems Do We Solve with Improvement Forecaster?
The best way to ensure that you will deliver a successful program result is to track progress against an objective continuously in a way that gives you early feedback so that course correction is possible. Coming up with these measures is not so easy, and this tool provides a framework (notion of half life) and a measure (guides for the value of a half life) so that teams can quickly generate the target for improvement. It also reinforces a data driven/evidence based culture that aligns the teams and management. Finally, it provides a weekly or monthly reporting tool for progress reporting, if required.
What are some considerations?
This estimation technique is most useful for process improvement and change management projects commonly found in IT, HR, and R&D. First check to see if this applies to your initiative. Second, if you can see a different way that improvement might be forecast based on external events (like monthly cycles, or gated by an IT system going live), use those more contextual estimates. Finally, organizational and technical complexity are hard to guess – use estimates and then perform a test of reasonableness on the predicted half life. If it seems off (or way off) don’t throw out the method, but adjust the half life estimate.
Improvement Forecaster Case Study
An organization has recently adopted a new Marketing Requirements Document (MRD) standard and process, but has not yet rolled it out. This organization has about 600 members in 4 different sites around the world and has little experience with process rollouts so it does not have a baseline to show management about adoption. From experience, this team knows that just declaring that you must do something new doesn’t work – so it has planned many training sessions and creating a support WiKi. But how fast should they expect adoption to 90% – i.e. how long will it be before 9 teams out of 10 have the new MRD?
Precise Definition: Out of the total projects listed as being in an early phase in monthly reports, how many this document?
Sample Baseline: Based on a quick analysis of the projects 0% have MRDs. The goal is 90%
Half life: 1 month (Example: Time to go from initial value of 0% to 1/2 the gap of 100% that value, or 50%)
Improvement Forecaster Visualization