Comparative Funding Models: Funding Innovation Programs
Most businesses today are looking to take advantage of innovation to drive revenue growth, but they lack 1) an overall strategic planning process for innovation and 2) methods to fund the R&D expense necessary to support expansion. Use this handy visualization tool to fund innovation programs. Business units that have R&D budgets below that of the corporate average are called “sources.” They source revenue allocations to other business units called “sinks” because the R&D budget allocation their sales generate, using the corporate average percentage, is lower than their spending. The sum of the sources and sinks yields the overall average.
This tool helps shift the debate about funding new innovation areas from the political to the strategic. By looking at your funding levels over time, it is possible to communicate to those business unit managers how the budget represents a tradeoff, and how they can make strategic allocations in the future based on models not politics.
Comparative Funding Model Visualization
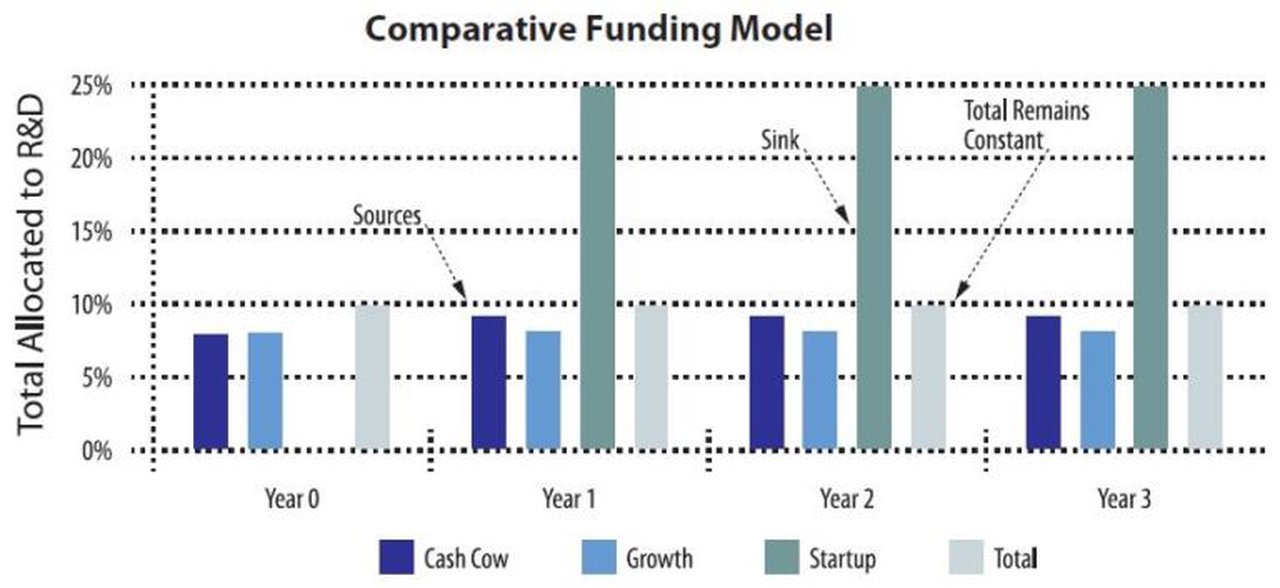
The bar chart shows relative R&D funding as a percentage of sales for three business units. The percentage is the vertical axis, and the years are shown on the horizontal axis. During years 1, 2, and 3 the startup division is funded by reallocating resources from two other units. However, note that R&D spending remains constant at 10% of sales.
What’s New in Comparative Funding Model?
Most businesses are looking to innovation or geographic expansion to drive revenue growth, but they lack methods to fund the necessary programs to support either strategy. This visualization tool gives managers the ability to see into the future and justify investments in new areas. It also allows management to communicate this information to shareholders and internal organizations.
Comparative Funding Model Benefits
- Translation of strategy into a financial model.
- Communicates this model to the wider organization to reduce politics and enable support of the vision.
- Helps create a more efficient budgeting process.
- Enables the capability to forecast the time at which business units turn from consumers of product development allocations into producers of allocations.
Which Business Problems Does the Comparative Funding Model Solve?
The challenge in today’s business environment is growth. In mature domestic markets, growth is difficult because market segments in general are saturated, so you need innovation to take market share from your competitors. Otherwise, you need to generate a whole new market approach and create a market of one. Another challenge is that businesses are underpenetrated in new markets in other parts of the world. In some cases, domestic businesses have not expanded to Europe and Asia, and in others they have not properly penetrated the BRIC (Brazil, Russia, India, and China) countries.
In any case, funding growth is a question of resource allocation. Businesses must allocate R&D expense from their existing lines of business and point them toward new areas. In order to maintain profitability, businesses must reduce expenses in some areas to offset investments in others. The Comparative Funding Models allow managers to see the reallocation today and forecast when these new areas will become self-funding.
What Else Should You Know about Comparative Funding Model?
Do not underestimate the investment level required to sufficiently fund the startup programs. Create a business plan for the new investment area with at least a three-year horizon. Your business plan also needs to look at all investments – including those in product development, marketing, sales, and capital costs – required for successful programs. Management needs to judge the plan and use it to set the initial budget. Then they need to determine the businesses they will use to source the required investment.
Next, consider how businesses can modify the plan over time to reflect the changing environment, as these programs often take more time than anticipated. This, however, becomes easier year after year as your track record is established.
Comparative Funding Model Case Study
Within NetCo, there is a business unit with three divisions - a “cash cow” division that has about 80% of the revenues, a smaller division that has a higher growth rate (“growth”), and a new division targeting an innovative new product space (“startup”) that involves routing for cloud and mobile devices. Going into this new investment area will not be inexpensive. The business case indicates that it will require $10M in its first year, $10M in its second year, and $15M in its third year. Given that it will take nearly a year to get to market, the first year’s revenues will be zero, and the second year’s revenues are estimated to be $5M after a conservative review of the business. However, in four years, “startup” will be the second largest and fastest-growing division in the group.
NetCo plans to fund this new division by reallocating resources from the “sources” (cash cow and growth) to the new “sink” (startup). They plan to cut the budgets of these two “source” business units by 10% (the first half through speeding up turnover and the second half through eliminating lower-priority projects). This process has four steps that they will complete in the following order:
- From the business plan, determine the cash needs of the new sink division.
- From a strategic look at the other profitable divisions, determine how to fund the new business unit.
- Model these findings over time to focus on higher-than-forecast startup expenses, as revenues will probably be later and smaller than anticipated.
- Socialize the model with business unit managers and incorporate it into budgets, which they will review on a yearly basis.
Download a template for the Comparative Funding Model.