—— Product Management ——
Attitude Influence Diagram: Eliminating Political Roadblocks
Have you ever had an excellent product concept derailed by internal politics? Of course you have because almost anyone who has been through the product development process more than a few times has experienced this. It is frustrating since good ideas that could benefit the company as well as the individuals involved are blocked for irrational causes. Can anything been done to help eliminate these roadblocks? The Attitude Influence Diagram is one tool that helps to overcome political obstacles. It is a scatter plot of your project’s supporters and detractors that helps you to isolate and manage the key individuals that might impede your success.
Attitude Influence Diagram Benefits
- Provides a visual political map to clarify the landscape around your team
- Pinpoints blocking managers who can disrupt your project
- Helps you do something about it before it affects the project
- Encourages you to consider the project environment
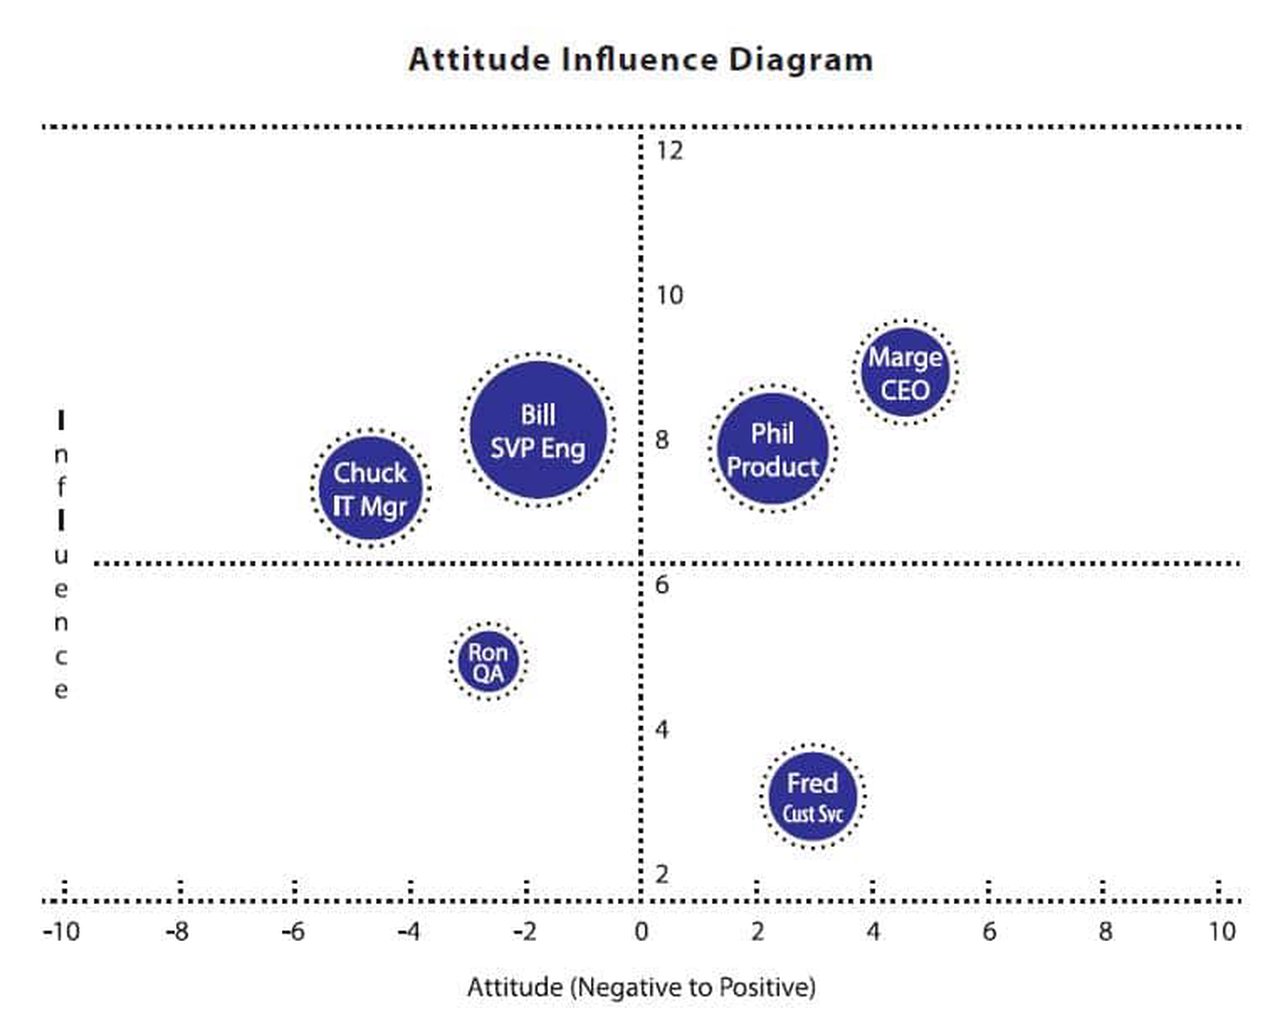
Plot individuals on the chart as bubbles, with their name and title inside each bubble. One axis indicates how much they support your project (their attitude), and the other indicates their level of influence. In the chart above, you can see that Chuck and Bill are the two potential project blockers, and they should be targets for in terms of garnering their support.
Their influence is determined by a combination of their position in an organization and how much influence they command based on seniority, intellect, or knowledge. The size of the bubble indicates the difficulty in changing their position, where a larger bubble means that it will be more difficult for you to influence them.
The Attitude Influence Diagram is a subjective assessment. However, it is a very powerful tool to quickly identify those who might impede your project. Applied early in the process, this tool gives you the opportunity to proactively manage detractors by ensuring that their concerns are addressed. In many cases, applying this tool will turn your detractors into supporters.
As you build the diagram think not only of senior leaders but also of individuals at lower levels of the organization who may wield influence. For example, a senior architect may be an individual contributor, but well respected in the organization. Their opinion could be highly influential.
Attitude may be more difficult to determine than influence, so start by identifying the most negative and most positive persons. Then as you populate the chart, you can gauge comparisons against the two extremes. This is not a process that should include a large number of people from the project team. You are best off if you create this diagram with at least two people, so you can get a more balanced view of the situation.
By looking at the quadrant of high influence and negative attitude, you can focus your persuasive efforts on individuals who are most likely to impede your success. After isolating the detractors, you need to create a simple strategy to approach them and work through their concerns. This may include:
- Sending the individual an email asking for input and requesting help
- Talking with him or her informally
- Arranging a one-on-one meeting with the influencer and a team member, or with someone outside the team that is very influential with that person
- Appealing to their manager (last resort)
Because management is now delegating more authority to teams, there is less top-down control and teams are now working more independently. In this environment you need techniques to help your team be successful without invoking the management chain. This graphical technique allows you to predict who may block the success of your program by helping you visualize supporters and detractors. It enables you to pinpoint and eliminate blockers without resorting to escalating the problem through your management hierarchy.
Which Business Problems Do We Solve with Attitude Influence Diagram?
Every organization has politics and not everyone is aligned with your objectives. The result is that managers sometimes stifle innovation because they are risk-adverse and want to preserve the status quo. Political blockers in your organization can also increase time-to-market because their negative attitudes often result in demands for more and more evidence to convince them that the project should move forward.
You have a limited time to negotiate the politics. This graphical technique pinpoints people and their position so that you can use your time wisely. Provided you have a menu of solutions, you can start to act, drawing from proven change management techniques to deal with the detractors.
What Else You Should Know about Attitude Influence Diagram
There is a big gap between identifying your detractors and eliminating their negative influence. What’s more important than this graphical technique are the skills to influence outcomes.
Sometimes it is challenging to agree on how to rank individuals. In addition to the recommendation of starting with the most positive and negative individuals, you can also do pairwise comparisons (e.g. comparing Bill with Frank and then Frank with Jill will help you find out how Bill and Jill compare).
Some may feel this technique is political in itself, so be careful about the people you select to help construct the diagram. Ensure that they use the information only to serve the success of the program.